


Stock Market Bubbles, Crowds and Credit
Stock-Markets / Stock Markets 2011 Feb 05, 2011 - 05:24 AM GMTBy: Doug_Wakefield

 “…now that the recession is over, we have to face the fact that the government must make cuts.”
“We put rules in place to prevent another financial crisis…” President Barack H. Obama, State of the Union, Tuesday, January 24 ‘11
Manias are fascinating to study in history, but are hard to accept if you are living through one. The most memorable ones in history require two elements, crowds and credit. While today’s global markets are littered with some of the most complex financial instruments in history, anyone studying the history of financial markets quickly recognizes that many of today’s tools for speculating on future price movements can be found as far back as the Amsterdam Exchange, founded in 1610. This exchange allowed speculators to take out margin loans, invest in shares of the East India Company, and purchase futures contracts on tulip bulbs. That’s right; tulip bulbs. 1
“By the later stages of the mania….paper credit created a perfect symmetry of insubstantiality: most transactions were for tulip bulbs that could never be delivered because they didn’t exist and were paid for with credit notes that could never be honored because the money wasn’t there.” 2
Now we move our time clocks forward almost 400 years. We examine a period that the vast majority of investors personally experienced; the roaring ‘90s. As the Dow roared up to it's top of 11,750, margin loans, stock shares, and futures contracts were still apart of this mania, like the Tulip Bulb mania of the early 1600s. Credit had exploded over the previous generation, with the belief that cutting edge ideas would always find money available to make the visionary rich. As the Dow topped out on January 14, 2000, the US national debt reached $5.7 trillion, a six-fold increase in just twenty years. How many investors were thinking about the havoc that such a rapid growth in debt could have on the pricing of not only their investments, but their daily lives? Listening to the “New Era” stories and watching the plethora of wealth being created almost overnight was much more emotionally rewarding. Why should an explosion of debt be a factor for individuals and institutions to consider when their money managers were boasting of their great gains, the speed in which wealth increased was seen as a symbol of your investment prowess, and the media was always there with another story of the paradigm shift that would take us to an ever higher standard of living?
Today, 11 years later, I still find it amazing to read the works of those who theorized tremendously higher prices ahead, and a plethora of options to attain this newfound wealth.
“It is to avoid buying into bubbles that followers of the Dow 36,000 Theory take the long view and count the cash. There are hundreds of stocks (and hundreds of mutual funds, if they are your preference) that offer high rewards at low risk.” 3
Dow 36,000: The New Strategy for Profiting From the Coming Rise in the Stock Market (1999), James Glassman and Kevin Hassett
Now we come forward to February 2, 2011. The Dow’s highest intra-day level was 12,057, just 308 points above the level hit on January 14, 2000. Millions want to believe the rhetoric that “the recession is behind us”, and that the “recovery” is gaining steam. However, the crowd, having just lived through the greatest loss of capital in history just 3 years ago, is awakening to the alarming pace at which debt and government spending is accelerating.
In order to gain our bearings, with the plethora of noise about the urgency of today’s hot market news, or the pleasant rhetoric that says, “don’t worry, leave the investing to us and your dreams will remain intact”, we need to look at the two prior market tops on the Dow, and gain perspective on the debt foundation that continues to increase risk throughout the entire global financial system.
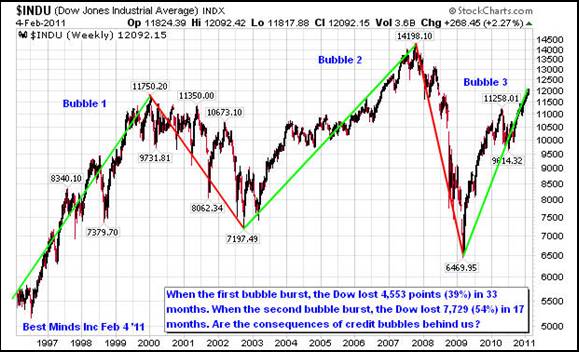
As already mentioned, the Dow finally topped from the credit/tech bubble on January 14, 2000 when the national debt stood at $5.7 trillion. After watching the Dow fall 4,553 points over 33 months, cheap credit and the promotion of the next scheme lead the Dow up to 14,198 on October 11, 2007. At this stage, the credit/real estate bubble fueled by massive levels of debt on top of debt schemes, had pushed the US national debt levels up to $9 trillion. The carnage that would follow would tear 7,729 points off the Dow in just 17 months.
Now we come to February 2, 2011. Millions went home today, having watched the Dow move ever upward like a smooth Caribbean cruise since the Dow closed right below 10,000 on August 26 ‘2010, with yet another positive emotional fix from repeatedly hearing “market makes new 2 year high”. However, how many mainstream financial pundits, or major news sources were warning their viewers that since the October 2007 high, just 39 months ago, the US national debt has grown by $5 trillion, moving the debt level to $14 trillion?
Look at it another way. It took 81 months between the completion of the credit/tech bubble and the credit/real estate bubble, and during that time, the US national debt grew $3.3 trillion. Since its March 2009 bottom, just only 23 months ago, the Dow has climbed faster than it did going into its historic January 2000 top, and the October 2007 top. If we start at the peak of the credit/real estate bubble in October 2007, we have also witnessed a $5 trillion growth in the US national debt in only 39 months; $3.3 trillion in 81 months followed by $5 trillion in 39 months. Let me state that again, …$3.3 trillion in 81 months followed by $5 trillion in 39 months….Hello? How can any sane financial, academic, military, spiritual, or political leader look at these numbers and honestly convince those who are listening to them that “the recovery is gathering steam”? Simple, because credit gives us the illusion of wealth and power, until wealth and power are taken from us.
In the spring of 2009, shortly after the market bottom, I received a call from an institutional manager with 40 years in the business. His comment still haunts me today and has been a part of several phone calls since. “Doug, it would appear that we have learned nothing. We are now starting a Treasury bubble”. Just 5 months before the March 2009 bottom, the world, and we had watched the Dow drop 3,770 points (32%) in six weeks.
While a corrective wave would have been in order, what we have watched since March 2009 is truly remarkable, and will certainly be included in the Hall of Fame of manias when we look back on this period. In order to place the current Dow rally in perspective, we must understand some major changes that have taken place at the foundational level since the 2007 global credit bubble burst.
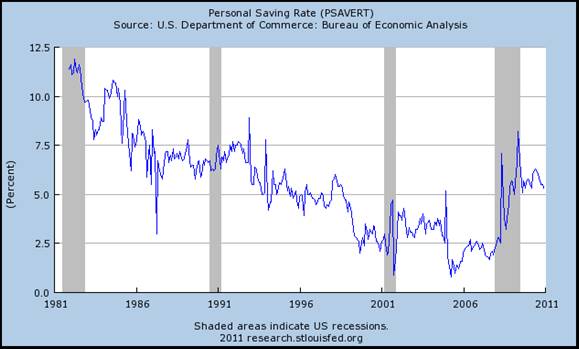
First, the sentiment among the average American attitude has changed regarding savings, having lived through the tech and real estate credit bubbles. Instead of buying everything on credit, the public’s desire to pay down debt and build savings has changed. The St. Louis branch of the Federal Reserve makes it clear that the appeal for increased savings is a change from a trend toward decreased savings that had been in place since 1981.
“….it s not lower interest rates per se that improve the economy, rather it is the people’s reaction to lower interest rates (that is, borrowing money to spend and saving less) that improves the economy.” 4
 Richard Koo, Chief Economist for Nomura Securities, author of Balance Sheet Recession: Japan’s Struggle with Uncharted Economics and It's Global Implications (2003).
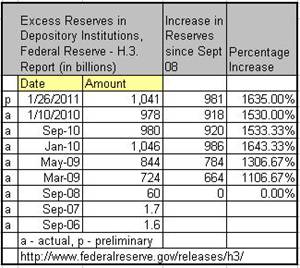
Second, the public was told that the nation’s largest banks needed capital in order to restore the lending mechanism in the system. Yet when one looks at the data on excess reserves, we see almost a trillion still sitting in the banking system today, almost 2 years since the March 2009 bottom in the Dow. Is there some reason that these banking giants are still sitting on this level of reserves, even though the “recession is behind us”?
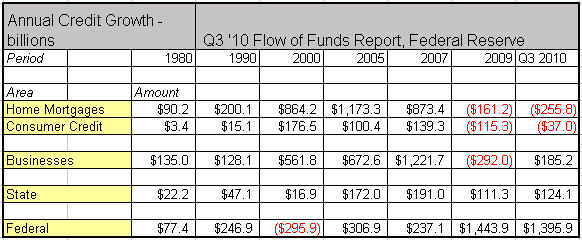
Third, we look at credit growth. Looking at the chart above, it should lead each of us to ask some hard questions. The Federal Reserve’s own data reveals that since 2007, home mortgage lending has collapsed from growing at an annual pace of $1,173 billion to contracting at a pace of $255 billion, and business lending has fallen from an annual pace of $1,221 billion to only $185 billion. This massive contraction of credit in the private sector has occurred during a period where individuals have watched the Dow recover 72% of its 7,729-point loss. Clearly, there is a massive disconnect between the economy and the stock market. If we then add the fact that the federal government, whom our own president recently announced “must make cuts”, has sought to pick up this massive contraction in credit by expanding it's own credit growth almost six fold since the 2007, then we are not looking at a true economic recovery, but a rising dependency on the state, and dependency on the nations of the world to lend these massive sums to the US. One realizes how extreme the current mania behavior has become when we compare Federal credit growth in 2009 and Q3 2010 with the US government deficits of $1.3 trillion in 2010, an improvement from the $1.4 trillion deficit in 2009.
Sadly, Americans would rather believe the lie, and trust that whoever, and however, their 401k and brokerage statements are growing in value, is somehow “too complicated” to understand. The reality of manias always boils down to crowds desiring something that history has already told them is impossible to sustain.
I asked Bob Lang of Lang Asset Management, if he would make a comment on crowds and credit, since he has been in investment management more than 50 years.
“I can recall advice given to me 10 years ago that was prescient. It was given in an environment where, in my naïve opinion, market optimism was unsustainable.
It was in 1999, when technology was the unquestioned growth vehicle, various ratios were so high that they were hard to accept as reality, and debt accumulation by the government was becoming a concern. I was contemplating changing our company’s long-term focus from being bullish to bearish since it was becoming increasingly obvious to me that the prospect of our clients continuing to profit from maintaining a long strategy in such an environment appeared to be highly unlikely. This was a major change since I had been optimistic about the country’s future (and the stock market) from the time I had entered the business in 1959.
I decided to talk to several members of the investment community that had already made the transition to the short side. One interview was particularly troublesome to me since the veteran presented an outcome that I just could not envision. His comments went like this: One of the most difficult factors to accept in a period of excessive speculation, where you know reality has taken its leave, is that the process can continue far longer than you think remotely possible. In fact, you may begin to question whether your assessment of the facts is accurate, while your newer clients have already made the determination that you are inflexible, terribly misguided, and should proceed immediately to participate in the never ending euphoria.” 5
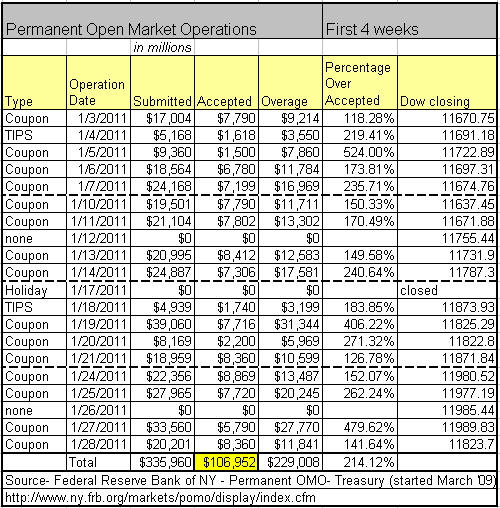
Bob opened a long/short, and a short only strategy in January 2000. For those starting at this juncture, he was seen as a savvy manager 3 years later. For those that rode the next credit bubble up, he was terribly misguided and inflexible. During the last 11 years, he has now seen two of the worst market crashes in history, and yet is still perceived as misguided. When your own market system allows enormous borrowing to occur daily by Wall Street banks for “liquidity” through the Permanent Open Market Operations (a program that just happened to start the same month the Dow hit its major bottom in March 2009 and available only to a small group of financial institutions), and the same banks continue to build their excess reserves to the highest levels in US history, it makes one wonder how long before this farcical period ends, and a true panic to sell sets in again.
“A crash is a collapse of the prices of assets, or perhaps the failure of an important firm or bank. A panic, “a sudden fright without cause”, from the god Pan, may occur in asset markets or involve a rush from less to more liquid assets. Financial crisis may involve one or both, and in any order. The collapse of South Sea stock and the Sword Blade Bank almost brought down the Bank of England. The 1929 crash and panic in the New York stock market spread liquidation to other asset markets, such as commodities, and seized up credit to strike a hard blow at output.” 6
Charles Kindleberger, Professor of Economics Emeritus at MIT, and author of Manias, Panics, and Crashes: A History of Financial Crises.
We are told there is plenty of “liquidity” to help foster “stability” in our markets. Yet history has always shown that while great ideals like the Declaration of Independence embrace the concept that “all men are equal”, this has never applied to financial markets. When one group of participants has the power to attain hundreds of billions in new reserves by which to “start over”, while others have no access to this enormous pool of credit, it becomes imperative to watch for continued changes at the systemic level of our markets….
“Even as financial markets collapsed last year[2008], high-frequency traders collectively enjoyed $21 billion in gross profit, according to Tabb Group. On the NYSE, daily volume surged 43% through June from a year earlier to 6.2 billion shares; high-frequency traders are believed to account for 50% to 70% of the activity and similar proportions in electronic futures and options markets… Some high frequency traders are sending out 1,000 orders a second." 7
…and warning signs that the unsustainable rally is once again coming to an end.
“Later, CEOs, who sold shortly before the peak [2000] would claim that they just got lucky. ‘Who knew?’ one told The Wall Street Journal. But it seemed that many knew. This was not what corporate PR departments dismissed as ‘part of a regular pattern of selling.’ This was a sudden bulge in insider sales. By February of 2000- just weeks before the Nasdaq would peak – insiders were selling 23 times as much stock as they bought, compared with the typical ratio of 10 to 1. In July, they were not fooled by a summer rally; that money the ratio remained at 22 to 1.” 8
Insiders have officially marked the top of the stock market: last week's insider selling of all stocks (not just S&P) hit an all time record of $4.5 billion. This is the biggest weekly number ever recorded by tracking company InsiderScore.com: as Sentiment Trader highlights no other week before had more than $2 billion in net selling. Furthermore, selling in just S&P companies hit a whopping $2.8 billion: over 4 times more than the week prior! As such the ratio of insider selling to buying is now meaningless. Even Bloomberg, which traditionally just posts the data without providing commentary to it, highlighted this ridiculous outlier:
"Insider selling at Standard & Poor’s 500 Index companies reached a record in the past week as executives took advantage of a two-year high in the stock-market to sell their shares."
We hope those retail investors who dared to reemerge in the stock market and play some hot potatoes with the big boys, enjoy their brief profit as they once again end up being the biggest fools. 9
As I continue to watch markets ignore world events like rioting in Egypt, Jordan, Yemen, and Tunisia, or the deterioration in sovereign debts across major European nations as bankers propose more debt to cover yesterday’s debt, or shortfalls in the tens of billions in state revenues across the US, I contemplate “the reason” that the public will be given for the start of the next major decline in prices that far so long have been elevated from reality. I dare say, I doubt we will hear that the public had grown complacent once again from the memorizing effect of constantly rising market prices, supported by beautiful lies from various leaders, solely to avoid living with the painful reality that we were continuing to ignore the lessons on crowds and credits from history.
So when will this ever stop repeating itself we ask? Only when the “unlimited debt” solution is no longer proposed as the solution, and the public refuses to listen to any leader who hails it as the latest solution to our problems.
Sources:
1 – Devil Take the Hindmost: A History of Financial Speculation (1999) Edward Chancellor, pg 10
2 – Ibid, pg 18
3 – Dow 36,000: The New Strategy for Profiting From the Coming Rise in the Stock Market (1999), James Glassman and Kevin Hassett, pg 36
4 – Balance Sheet Recession: Japan’s Struggle with Uncharted Economics and It’s Global Implications (2003), Richard Koo, pg 40
5 – Bob Lang is CEO and Chairman of Lang Asset Management. His comments were made to the author on February 1, 2011. (www.langasset.com)
6 – Manias, Panics, and Crashes: A History of Financial Crises, Fourth Edition (2000), Charles P. Kindleberger, pg 105
7 – The New Masters of Wall Street, Forbes, September 21, 2009
8 – Bull: A History of the Boom, 1982-1999 (2003) Maggie Mahar, pgs 317-318
9 –Insider Selling Hits All Time Record of $4.5 billion in Prior Week as Everyone is Getting out of the Market, Zero Hedge, November 11, 2010
Due to the levels we have reached in this mania, and the manipulation we have watched unfold in the last 2 years, I have decided to place my entire research report, Riders on the Storm: Short Selling in Contrary Winds (2006), on the web. The document can be downloaded for free by clicking this link, or scrolling down to Recent Updates on the Best Minds Inc homepage. 2011 is setting up to require a totally different view of strategies than the last 2 years, and during this time of enormous deception will require examining a wide range of markets through a variety of lenses.
If you are interested in our most comprehensive research, consider a subscription to
The Investor's Mind: Anticipating Trends through the Lens of History.
Doug Wakefield
President
Best Minds Inc. , A Registered Investment Advisor
3010 LBJ Freeway
Suite 950
Dallas , Texas 75234
doug@bestmindsinc.com
phone - (972) 488 -3080
alt - (800) 488 -2084
fax - (972) 488 -3079
Copyright © 2005-2011 Best Minds Inc.
Best Minds, Inc is a registered investment advisor that looks to the best minds in the world of finance and economics to seek a direction for our clients. To be a true advocate to our clients, we have found it necessary to go well beyond the norms in financial planning today. We are avid readers. In our study of the markets, we research general history, financial and economic history, fundamental and technical analysis, and mass and individual psychology.
Disclaimer: Nothing in this communiqué should be construed as advice to buy, sell, hold, or sell short. The safest action is to constantly increase one's knowledge of the money game. To accept the conventional wisdom about the world of money, without a thorough examination of how that "wisdom" has stood over time, is to take unnecessary risk. Best Minds, Inc. seeks advice from a wide variety of individuals, and at any time may or may not agree with those individual's advice. Challenging one's thinking is the only way to come to firm conclusions.
Doug Wakefield Archive |
© 2005-2022 http://www.MarketOracle.co.uk - The Market Oracle is a FREE Daily Financial Markets Analysis & Forecasting online publication.