


U.S. Labor Force and Unemployment Statistical BS
Economics / Economic Statistics Feb 05, 2011 - 04:29 AM GMTBy: Mike_Shedlock

 I had no idea what to expect in today's jobs report. ADP projected 187,000 jobs but has been wildly off numbers reported by the BLS. Economists expected +146,000 jobs. The actual establishment survey report shows +36,000.
I knew huge revisions and methodology changes were coming this month would make gaming the report a crap-shoot. However, the amazing thing in the jobs report was not the number of jobs, but the statistical sleight-of-hand in the unemployment rate.
Statistical BS
The unemployment rate (based on the household survey), unexpectedly fell from 9.4% to 9.0%. How did that happen?
Based on population growth, the labor force should have been expanding over the course of a year by about 125,000 workers a month, a total of 1.5 million workers. Instead, (for the entire year) the BLS reports that the civilian labor force fell by 167,000. Those not in the labor force rose by 2,094,000. In January alone, a whopping 319,000 people dropped out of the workforce.
To get the unemployment rate down from 9.8% to 9.0%, you simply do not count two million workers. Look on the bright side, at this rate we will be back to full employment in no time.
Huge Downward Revisions
One way to make recent numbers look better is to revise the historical data downward. Today we have a third massive backward revision since the beginning of the recession.
"The total nonfarm employment level for March 2010 was revised downward by 378,000 (411,000 on a seasonally adjusted basis). The previously published level for December 2010 was revised downward by 452,000 (483,000 on a seasonally adjusted basis)."
Decade of Revisions Next Year
"The population control adjustments introduced with household survey data for January 2011 were applied to the population base determined by Census 2000. The results from Census 2010 will not be incorporated into the household survey population controls until the release of data for January 2012."
Hallelujah, the recent census report will provide fertile ground to revise away anything the BLS wants.
January Jobs Report
Please consider the Bureau of Labor Statistics (BLS) January 2010 Employment Report.
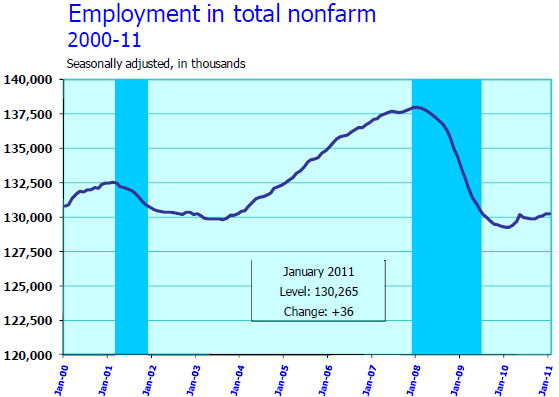
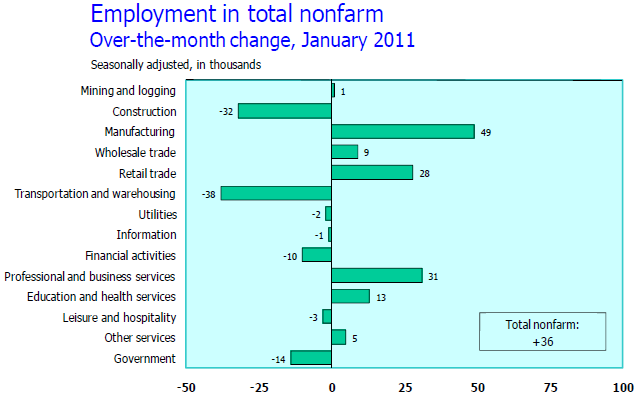
The unemployment rate fell by 0.4 percentage point to 9.0 percent in January, while nonfarm payroll employment changed little (+36,000), the U.S. Bureau of Labor Statistics reported today. Employment rose in manufacturing and in retail trade but was down in construction and in transportation and warehousing. Employment in most other major industries changed little over the month.
Unemployment Rate - Seasonally Adjusted
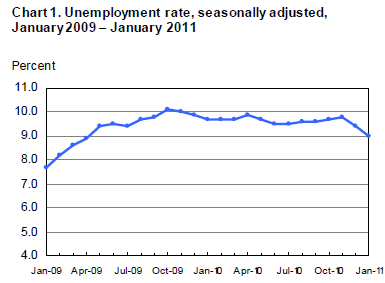
Bear in mind, were it not for millions of people allegedly dropping out of the labor force over the last year, the unemployment rate would be over 11% right now.
Nonfarm Payroll Employment - Seasonally Adjusted
Establishment Data
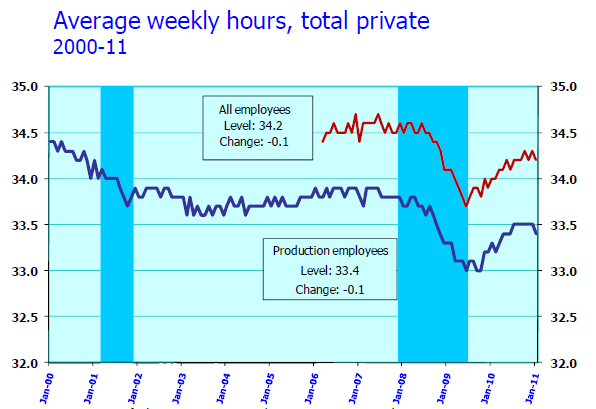
The average workweek for all employees on private nonfarm payrolls fell by 0.1 hour to 34.2 hours in January. The manufacturing workweek for all employees rose by 0.1 hour to 40.5 hours, while factory overtime remained at 3.1 hours. The average workweek for production and nonsupervisory employees on private nonfarm payrolls declined by 0.1 hour to 33.4 hours; the workweek fell by 1.0 hour in construction, likely reflecting severe winter weather.
In January, average hourly earnings for all employees on private nonfarm payrolls increased by 8 cents, or 0.4 percent, to $22.86. Over the past 12 months, average hourly earnings have increased by 1.9 percent. In January, average hourly earnings of private-sector production and nonsupervisory employees rose by 10 cents, or 0.5 percent, to $19.34.BLS Birth-Death Model Black Box
The big news in the BLS Birth/Death Model is the BLS is going to move to quarterly rather than annual adjustments.
Effective with the release of January 2011 data on February 4, 2011, the establishment survey will begin estimating net business birth/death adjustment factors on a quarterly basis, replacing the current practice of estimating the factors annually. This will allow the establishment survey to incorporate information from the Quarterly Census of Employment and Wages into the birth/death adjustment factors as soon as it becomes available and thereby improve the factors.
For more details please see Introduction of Quarterly Birth/Death Model Updates in the Establishment Survey
In recent years Birth/Death methodology has been so screwed up and there have been so many revisions that it has been painful to watch.
It is possible that the BLS model is now back in sync with the real world. Moreover, quarterly rather than annual adjustments can only help the process.
The Birth-Death numbers are not seasonally adjusted while the reported headline number is. In the black box the BLS combines the two coming out with a total.
The Birth Death number influences the overall totals, but the math is not as simple as it appears. Moreover, the effect is nowhere near as big as it might logically appear at first glance. Do not add or subtract the Birth-Death numbers from the reported headline totals. It does not work that way.
Birth/Death assumptions are supposedly made according to estimates of where the BLS thinks we are in the economic cycle. Theory is one thing. Practice is clearly another as noted by numerous recent revisions.
Birth-Death Number Revisions
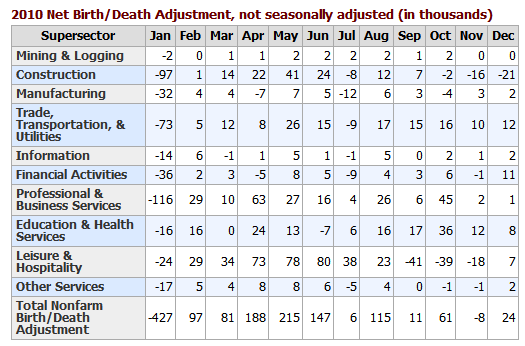
Inquiring minds note enormous backward revisions in Birth-Death reporting. Here is the chart for 2010 that I showed last month.
Birth Death Model Revisions 2010 (as reported last month)
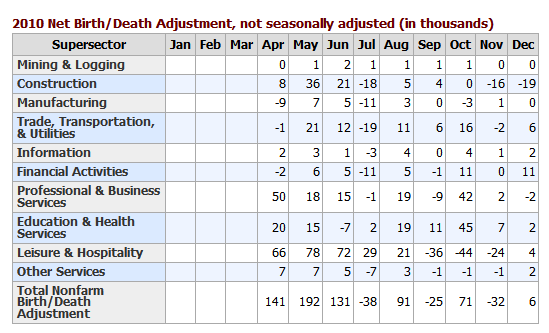
Birth Death Model Revisions 2010 (as reported this month)
Is this new model going to reflect reality going forward?
That's hard to say, but things were so screwed up before that it is unlikely to be any worse. One encouraging sign is several negative numbers in the recent chart. January would have been negative too, had they shown it. Historically there were only 2 negative number every year, January and July. That anomaly broke November of 2010.
Household Data
In the last year, the civilian population rose by 1,872,000. Yet the labor force dropped by 167,000. Those not in the labor force rose by 2,094,000. In January alone, a whopping 319,000 people dropped out of the workforce.
Households Stats
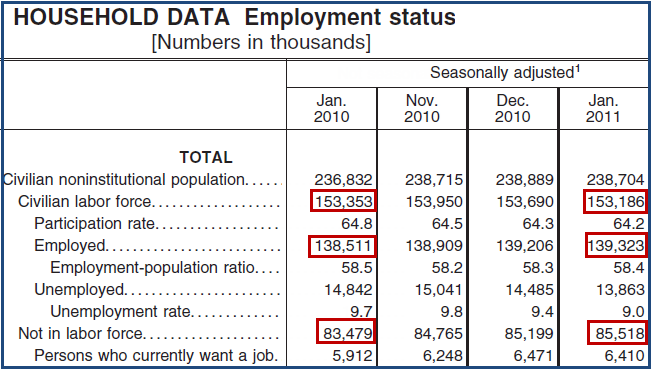
- The number of unemployed persons decreased by about 600,000 in January to 13.9 million, while the labor force was unchanged. (Based on data adjusted for updated population controls)
- The number of long-term unemployed (those jobless for 27 weeks or more) edged down to 6.2 million and accounted for 43.8 percent of the unemployed.
- After accounting for the annual adjustment to the population controls, the employment-population ratio (58.4 percent) rose in January, and the labor force participation rate (64.2 percent) was unchanged.
- The number of persons employed part time for economic reasons declined from 8.9 to 8.4 million in January. These individuals were working part time because their hours had been cut back or because they were unable to find a full-time job.
- In January, 2.8 million persons were marginally attached to the labor force, up from 2.5 million a year earlier. (These data are not seasonally adjusted.) These individuals were not in the labor force, wanted and were available for work, and had looked for a job sometime in the prior 12 months. They were not counted as unemployed because they had not searched for work in the 4 weeks preceding the survey.
Table A-8 Part Time Status
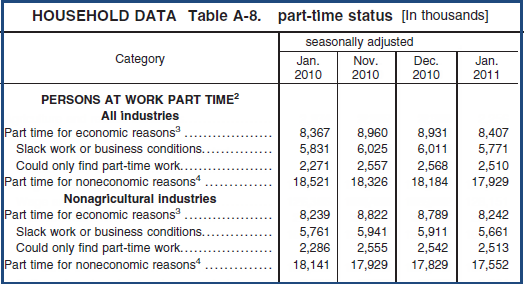
There are now 8,407,000 workers whose hours may rise before those companies start hiring more workers.
Table A-15
Table A-15 is where one can find a better approximation of what the unemployment rate really is.
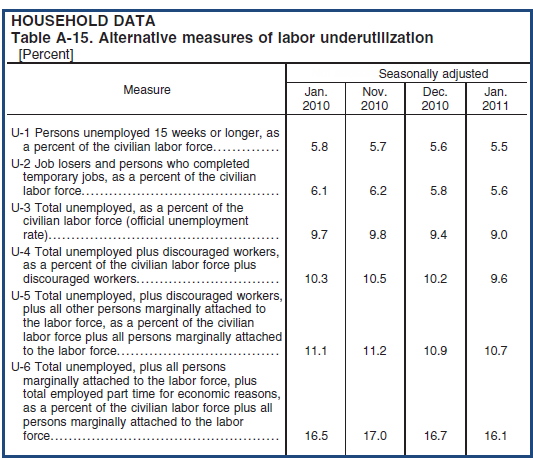
Grim Statistics
Given the total distortions of reality with respect to not counting people who allegedly dropped out of the work force, it is hard to discuss the numbers.
The official unemployment rate is 9.0%. However, if you start counting all the people that want a job but gave up, all the people with part-time jobs that want a full-time job, all the people who dropped off the unemployment rolls because their unemployment benefits ran out, etc., you get a closer picture of what the unemployment rate is. That number is in the last row labeled U-6.
While the "official" unemployment rate is an unacceptable 9.0%, U-6 is much higher at 16.1%. Moreover, both the official rate and U-6 would be much higher were it not for huge numbers of people dropping out of the workforce.
Things are much worse than the reported numbers would have you believe.
Click Here To Scroll Thru My Recent Post List
By Mike "Mish" Shedlock
http://globaleconomicanalysis.blogspot.com
Mike Shedlock / Mish is a registered investment advisor representative for SitkaPacific Capital Management . Sitka Pacific is an asset management firm whose goal is strong performance and low volatility, regardless of market direction.
Visit Sitka Pacific's Account Management Page to learn more about wealth management and capital preservation strategies of Sitka Pacific.
I do weekly podcasts every Thursday on HoweStreet and a brief 7 minute segment on Saturday on CKNW AM 980 in Vancouver.
When not writing about stocks or the economy I spends a great deal of time on photography and in the garden. I have over 80 magazine and book cover credits. Some of my Wisconsin and gardening images can be seen at MichaelShedlock.com .
© 2011 Mike Shedlock, All Rights Reserved.
© 2005-2022 http://www.MarketOracle.co.uk - The Market Oracle is a FREE Daily Financial Markets Analysis & Forecasting online publication.