


How To Spot and Trade Stock Market Negative Divergences
Stock-Markets / Stock Markets 2011 Feb 04, 2011 - 02:26 AM GMTBy: David_Grandey

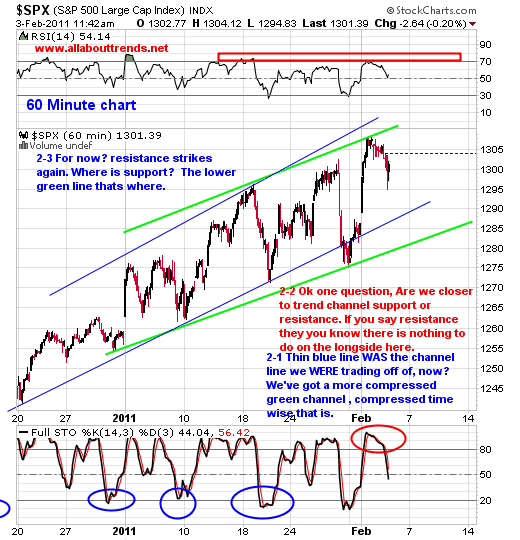
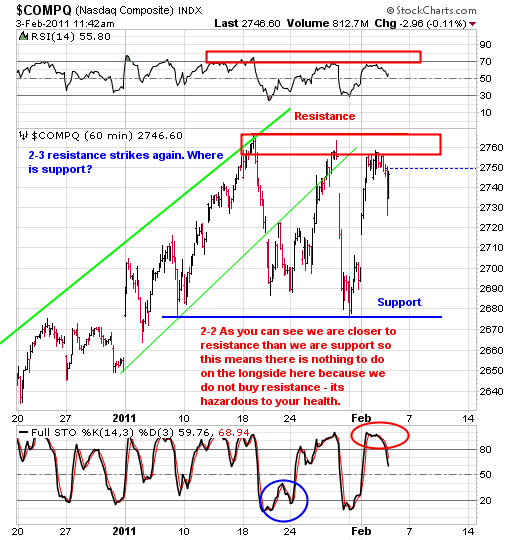
 Well once again it’s all about the 60-minute charts with support and resistance clearly defined. We made a move up to resistance and are now in the process of turning around here.
Let’s take a look at the RUT — Russel 2000 small cap index. We’ve talked a lot about the OTC leading both up and down over the years when actually the RUT is typically the index that really leads.
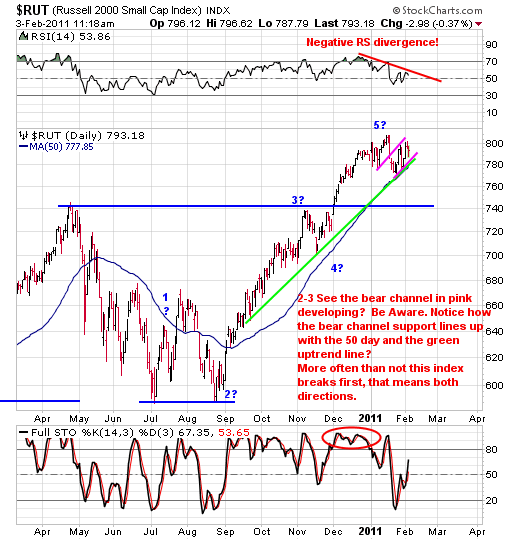
The key points in this chart are that of the Negative RS (Relative Strength) Divergence, the Pink Bear channel, the green uptrend line and the 50 day average.
Look at the RS divergence showing up in this chart (the indicator at the top) what exactly does this mean? In short it means that under the hood of that bright shinny car on the show room floor the engine isn’t firing on all cylinders.
What you see is that while the index hits a peak and registers a high on the RS the index then pulls back and makes another run to the highs only this time the RS does not confirm the highs by matching the first RS peak. Said another way- its not as broad based and strong of a move with everyone participating.
Most market peaks, highs, tops call it what you want occur like this. The when you look at a lot of names putting in double tops? The market is talking.
Moving on to the Pink lines- those are a bear channel which as the name implys is bearish in nature.
Whats interesting about it is that it also corresponds with the 50 day average and the green uptrendline which both act as a diagonal support levels if you will.
A downside break with conviction gets the ball rolling to the downside. Of course you’ll need follow through to the downside too which is what we havent been getting as of late but its gotta happen some time just as the market does every year and that is goes into a correction.
By David Grandey
www.allabouttrends.net
To learn more, sign up for our free newsletter and receive our free report -- "How To Outperform 90% Of Wall Street With Just $500 A Week."
David Grandey is the founder of All About Trends, an email newsletter service revealing stocks in ideal set-ups offering potential significant short-term gains. A successful canslim-based stock market investor for the past 10 years, he has worked for Meriwest Credit Union Silicon Valley Bank, helping to establish brand awareness and credibility through feature editorial coverage in leading national and local news media.
© 2011 Copyright David Grandey- All Rights Reserved Disclaimer: The above is a matter of opinion provided for general information purposes only and is not intended as investment advice. Information and analysis above are derived from sources and utilising methods believed to be reliable, but we cannot accept responsibility for any losses you may incur as a result of this analysis. Individuals should consult with their personal financial advisors.
© 2005-2022 http://www.MarketOracle.co.uk - The Market Oracle is a FREE Daily Financial Markets Analysis & Forecasting online publication.