The Growth Recession and Early Stages of a Housing Depression
Economics / US Economy Oct 30, 2007 - 12:37 AM GMTBy: John_Mauldin
 This week in Outside the Box, Van Hoisington and Dr. Lacy Hunt of Hoisington Management undertake an assiduous analysis of the economy, specifically quantifying the underlying impact of the real estate market on GDP growth through the follow-on adverse effects on consumer spending.
As outlined in previous publications, the housing debacle has not by any stretch of the imagination reached bottom, having an estimated $800 billion of adjustable rate mortgages reset between October 2007, and December 2008. These resets Hoisington indicates are the home buyers who bought at the top of the 2006 housing market, many of whom paid zero down and received mortgage rates of 0%.
A somber fact: estimated current market value of homes is $21.0 Trillion; historically having one dollar change in wealth equate to a five-cent change in consumer spending — would result in $210 billion reduction in consumer spending, given a 20% decline in home prices, or a wealth loss of $4.2 trillion. Others think this estimate conservative, Dr. Robert Shiller of Yale University has calculated that home prices would have to decline by 50% to be at par with cost of rental housing.
Hoisington Investment Management Company focuses on long-term investment strategies based on Economic Analysis. The firm is a registered investment advisor specializing in fixed income portfolios with over $3.5 billion under management for large institutional clients. Van R. Hoisington is the President and Chief Investment Officer and has produced an outstanding fifteen-year performance record. Dr. Lacy Hunt, an internationally known economist, joined the firm in 1996 adding depth and expertise with his in-depth research and analysis.
John Mauldin, Editor
Outside the Box
Quarterly Review and Outlook
Third Quarter 2007
By Van R. Hoisington and Lacy H. Hunt, Ph.D
GROWTH RECESSION
A growth recession is a time in which the economy expands, but at a pace insufficient to provide jobs for all labor force entrants, thus increasing the unemployment rate, according to the late Dr. Solomon Fabricant of NYU and the National Bureau of Economic Research. Another definition of growth recession is when the economy grows at less than its potential growth rate, which equals changes in productivity plus changes in the labor force. In the third quarter, real GDP expanded by an estimated 3.5% annual rate, or approximately equal to the economy's potential growth rate. However, over the past four quarters the 2.5% growth rate was well below potential. Not surprisingly, therefore, the unemployment rate in September stood at 4.7%, up 0.3% from the low of 4.4% reached six months earlier.
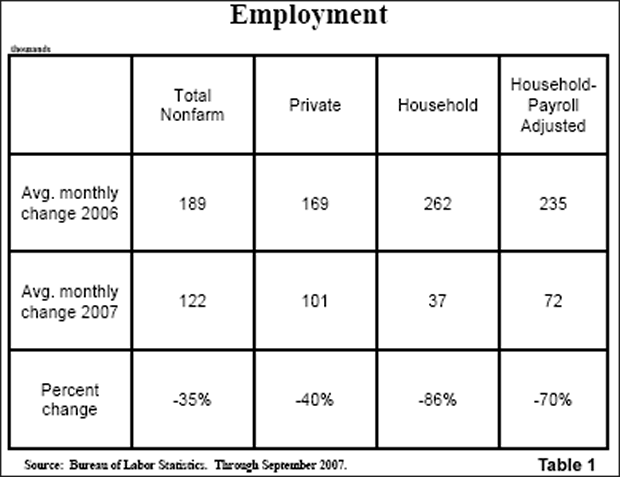
Similarly, other measures of labor market performance have deteriorated, serving to confirm the arrival of a growth recession. For example, in the first nine months of this year the average monthly gains in total and private nonfarm employment registered increases that were 35% and 40% lower than the monthly average for all of 2006. An alternative measure of employment (the household series) that offers a more accurate measurement of job growth at economic turning points, com showed a more significant job shortfall. Compared to all of 2006, household employment, adjusted to a similar configuration as the payroll series, posted a decline of 70%, and the unadjusted household survey was 86% (Table 1). In fact, in the past six months household employment is up only a cumulative total of 3,000 new jobs. The weakness in the labor markets helps to explain why consumer sentiment, as measured by the University of Michigan, fell to a fourteen month low in early October, and the year to year quarterly growth rate of retail sales has declined to 4%, compared with a 7.7% growth rate peak recorded in the first quarter of 2006.
DIVERGENCE BETWEEN DOMESTIC DEMAND AND REAL GDP
Another major developing economic trend has been the shortfall in real final sales to domestic purchasers (GDP less net exports and inventory investment) when compared with the total GDP. Real final sales to domestic purchasers, also referred to as domestic demand, is estimated to have registered a sub-par 2% annual growth rate in the third quarter, about 1.5% below the potential. This was weaker than in the second quarter when domestic demand increased at a 2.1% pace compared with the 3.8% real GDP. This divergence of GDP outperforming domestic demand was due to a substantial reduction in net exports, a trend that is likely to continue.
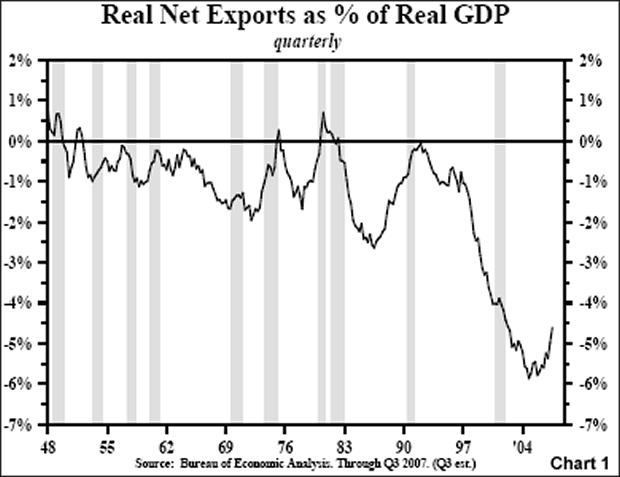
The real net exports deficit relative to GDP improved to an estimated 4.6% of GDP in the third quarter, down from 5% in the second quarter and 5.9% at its worst point in the fourth quarter of 2004 (Chart 1). The reason for the trade improvement is that import growth has slowed sharply in response to weaker domestic demand. In the last twelve months, real U.S. imports of goods rose a miniscule 0.5 %, down from the 8.5% growth rate in the twelve months ended August 2006, reflecting the slowdown in consumer spending. Concurrently, exports strengthened in response to growth in emerging economies and a lower dollar. But, the improving U.S. trade account is a double-edged sword. While it serves to support U.S. GDP growth, it transmits the slower U.S. domestic demand to the rest of the world.
HOUSEHOLD LEVERAGE - UNCHARTED TERRITORY
Considering the sharp declines in housing activity this year, it might seem logical that the household sector had begun the deleveraging process. That, however, was not the case. This sector became even more deeply indebted, as noted by the following three dynamics.
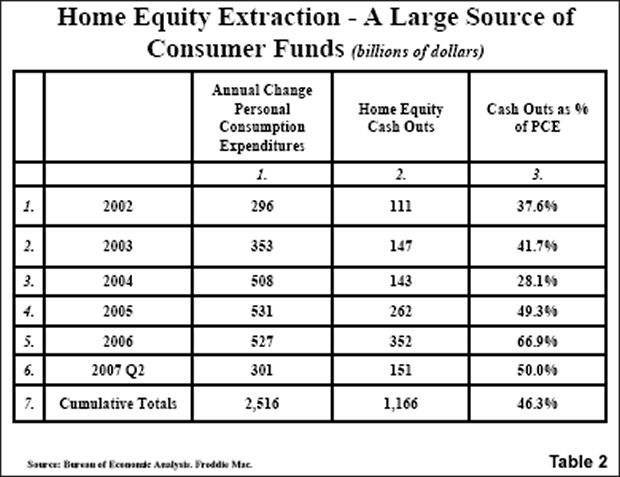
First, home equity cash outs, as tabulated by Freddie Mac, totaled $151 billion, or an amount equal to 50% of the rise in total consumer spending (PCE) during the initial two quarters of 2007. Not all of the proceeds of the equity extractions went toward consumer spending, yet the total sum was a substantial source of liquidity for the consumer. More amazing, perhaps, is the fact that over the past 5 1/2 years, $1.1 trillion in equity has been extracted from homes. This represents 46% of the increase in total consumer spending over the same period (Table 2). The tightening of credit standards and declining home prices will virtually guarantee that $1.1 trillion will not be extracted in the next few years. Consequently, slower consumer outlay growth can be expected for an extended period.
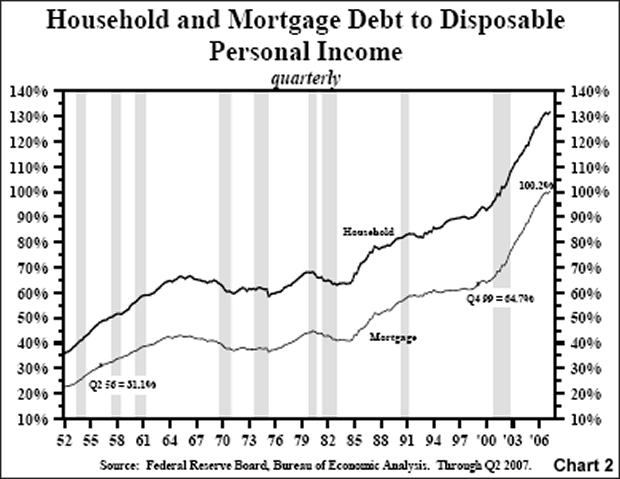
Second, at the end of the second quarter, household mortgage debt totaled $10.143 trillion, compared with $4.295 trillion in 1999. Thus, in six and a half years the household sector's mortgage debt increased by $5.8 trillion, or 136%. While the aggregate debt figures are interesting, the relevant measure is the relationship between mortgage debt and household income. If personal income were also rising rapidly, then households would be in position to make the required interest and amortization payments. However, incomes have lagged. Consequently, mortgage debt relative to disposable personal income surged from 64.7% at the end of 1999 to 100.2% at the end of the second quarter of this year. This 35.5% rise since was greater than the rise over the 43 years leading up to 1999. (Chart 2).
Third, total household debt relative to disposable personal income also continued to move ever higher. At the end of the second quarter, this ratio jumped to a new record of 131%, up from 93.6% at the end of 1999, as households continued to accumulate other types of debt and splurged on mortgages. Total household debt includes mortgage debt, consumer installment loans, and all other types of consumer debt obligations.
RECORD AGGREGATE INDEBTEDNESS
It is widely known that the nonfinancial corporate sector's financial condition has improved, so perhaps it is presumed that the overall economy's financial situation is more manageable. This may not be the case. Corporate debt levels have been rising for the last two years, and are much higher than what this sector has historically carried.
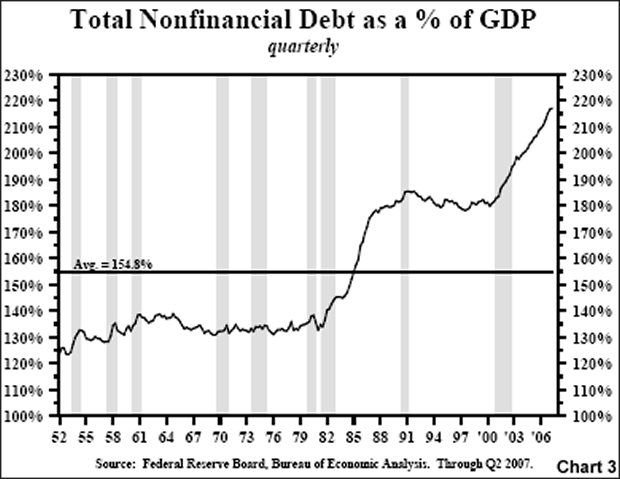
Nonfinancial corporate debt amounted to 43.7% of GDP at the end of the second quarter, up 2.1% from the fourth quarter of 2005. From 1952 to the present, this corporate debt averaged a far less 34.3% of GDP. The record household and the above average business debts resulted in a total nonfinancial sector debt that was an unsurpassed 217% of GDP in the second quarter of this year (Chart 3). From 1952 to the present, this debt averaged a far lesser 154.8%.
The Fed's reduction of short-term rates serves to lessen slightly the finance charges of these massive debt burdens, but it does not reduce the magnitude of those obligations relative to income. Moreover, the reduction in short-term interest rates will not serve, at least for the next year or two, to make the household debt more manageable in relation to home prices to which those debts are also directly tied. Thus, credit losses stemming from the debt binge of this decade are far from being realized, and the recent tremors of the credit markets may be a sign that all is not well.
EARLY STAGE HOUSING DEPRESSION
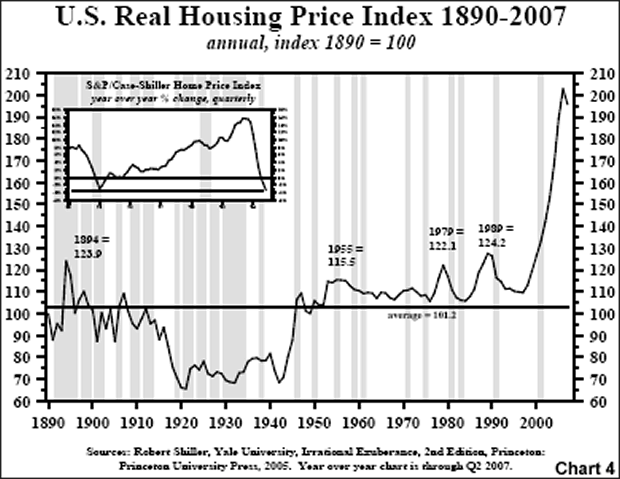
Four considerations suggest that the current housing depression will continue for at least the next two years. First, home prices remain near record highs in spite of the largest yearly decline on record. From the 2006 peak, housing prices, in inflation adjusted terms, declined 3.4% thus far in 2007 according to the Shiller Real Housing Price Index. Nevertheless, real home prices remained nearly 58% above the previous cyclical high reached in 1989, and almost 94% above the average real price from 1890 through 2007 (Chart 4). As noted earlier, the unprecedented advance from 1999 through 2006 was directly tied to an equally unmatched growth in mortgage debt. Debt fueled the price surge, and now the debt must be serviced and amortized in an environment of falling prices. Those who bought after mid 2005 will continue to experience a net wealth loss.
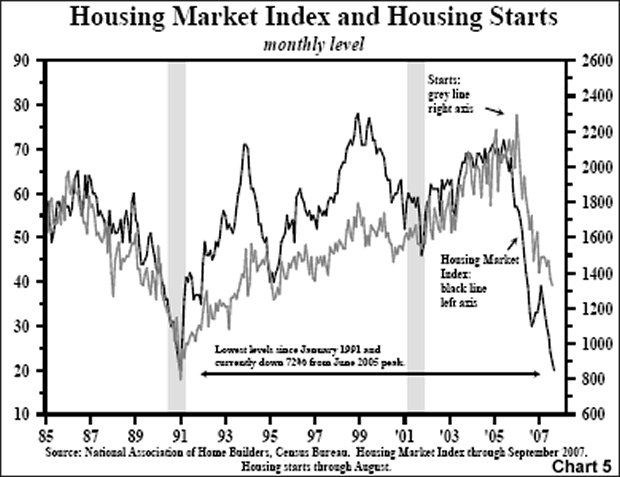
Second, housing starts and building permits are still well above prior cyclical lows, despite the 42% decline in both. The housing market index, compiled from the National Association of Home Builders, has declined 72% from its cyclical peak in June 2005. At their cyclical lows in the 1990-91 and 2000-01 recessions, starts and permits were aligned with the housing market index (Chart 5); thus, more contraction is anticipated. Housing starts and building permits are available since 1959, showing cyclical lows in housing starts and building permits during the past seven recessions averaged just 1.0 million and .919 million, respectively. To fall to these average cyclical lows, starts and permits would need to contract another 25% and 30%, respectively, from current levels. But, the decline could easily be even greater in view of the massive bubble in housing that resulted from the unparalleled boom of this decade.
Third, there is a record inventory of unsold homes relative to sales--nearly ten months for existing homes and 8.2 months for new homes. This suggests that there will need to be additional cuts in building permits and housing starts. Moreover, even these dire figures understate the magnitude of the problem, for the sales figures do not include cancellations of past sales, some of which are reported to be in excess of 30%.
Fourth, nearly $800 billion of adjustable rate mortgages will reset between October 2007 and December 2008, with the peak in the first and second quarters of 2008. Those will include the home buyers who bought at the top of the housing market in 2006, many of whom paid zero down and received teaser mortgage rates of either 0% or something very close. Defaults on these resets are likely to be quite large since the buyers will have significant negative equity in the homes, and there is little economic incentive not to turn the keys over to their institutional lenders. Indeed, evidence already suggests that process is well under way. In August, defaults on privately insured home loans soared 30% from the year earlier level. As defaults continue to rise, the supply of existing home inventory is likely to surge further, putting additional downward pressure on home prices and leading to an even greater wealth loss for solvent households.
WEALTH EROSION
The wealth loss in houses will cause consumers to save more and retrench on spending, a process that is in its infancy. If real home prices were to decline another 20%, the index level would be about 156, or 26% above the old historical peak of 124.2 reached in 1989 (Chart 4). Some estimate that the ultimate fall in home prices could be even greater. Dr. Robert Shiller of Yale University has calculated that home prices would have to fall 50% for home prices to be aligned with cost of rental housing. Historically, there may be some merit in this argument as rents and home prices, over long periods of time, do equilibrate.
At mid-year, the market value of homes, according to the Federal Reserve's flow of funds accounts, was $21.0 trillion. A 10%, 20% and 30% decline in home prices from present levels would result in a wealth loss to the household sector of $2.1, $4.2 or $6.3 trillion, respectively. If Shiller's calculation concerning rent and home prices is correct, and the drop is 50%, the wealth loss would be a massive $10.5 trillion. Historically, a one dollar change in wealth has equated to a five cent change in consumer spending. Thus, a 20% decline in home prices would result in a $4.2 trillion wealth loss and a $210 billion reduction in consumer spending.
While a decline in wealth would be spread out over time, the housing sector would impair consumer spending in other ways. Falling home prices will result in additional losses for the financial sector, which, in turn, will tighten lending standards and reduce credit availability for consumer spending. Also, job losses in housing and related sectors will limit the growth in household income, putting consumer spending under downward pressure. Accordingly, domestic demand growth should continue to weaken, serving to transmit the U.S. growth recession to the rest of the world.
CONSTRUCTIVE BOND MARKET OUTLOOK
A continuing contraction in both the growth of total reserves and the transactions-based monetary aggregates, as well a downturn in the velocity of money, suggest that monetary conditions remain restrictive. These monetary considerations, combined with greater slack in the labor markets, will serve to put additional downward pressure on the inflation rate. Even though a weak dollar and increases in commodity prices suggest that inflation will rise, this is not likely to be the case. Demand will be too weak to allow cost increases to be passed along to consumers. Thus, weakness in domestic demand suggests that profit margins will be compressed in this environment.
In the latest twelve months, the core real personal consumption expenditures deflator rose at a 1.8% annual rate, down from a peak of 2.5% reached in February of this year. Over the next six months, this measure of inflation should ease toward 1.5%. This is good news for bond investors. Moreover, the highly leveraged condition of the U.S. economy, as well as the huge volume of mortgage resets scheduled for the first half of 2008, suggest that exiting the growth recession will not occur quickly or easily. Indeed, no growth, or an outright recession, is a distinct possibility. In this environment, the entire Treasury yield curve should shift downward. The greatest returns will accrue to those investors positioned in the long-end of the Treasury bond market.
Your anticipating an economic contraction analyst,
By John Mauldin
http://www.investorsinsight.com
To subscribe to John Mauldin's E-Letter please click here: http://www.frontlinethoughts.com/subscribe.asp
Copyright 2007 John Mauldin. All Rights Reserved
John Mauldin is president of Millennium Wave Advisors, LLC, a registered investment advisor. All material presented herein is believed to be reliable but we cannot attest to its accuracy. Investment recommendations may change and readers are urged to check with their investment counselors before making any investment decisions. Opinions expressed in these reports may change without prior notice. John Mauldin and/or the staff at Millennium Wave Advisors, LLC may or may not have investments in any funds cited above. Mauldin can be reached at 800-829-7273.
Disclaimer PAST RESULTS ARE NOT INDICATIVE OF FUTURE RESULTS. THERE IS RISK OF LOSS AS WELL AS THE OPPORTUNITY FOR GAIN WHEN INVESTING IN MANAGED FUNDS. WHEN CONSIDERING ALTERNATIVE INVESTMENTS, INCLUDING HEDGE FUNDS, YOU SHOULD CONSIDER VARIOUS RISKS INCLUDING THE FACT THAT SOME PRODUCTS: OFTEN ENGAGE IN LEVERAGING AND OTHER SPECULATIVE INVESTMENT PRACTICES THAT MAY INCREASE THE RISK OF INVESTMENT LOSS, CAN BE ILLIQUID, ARE NOT REQUIRED TO PROVIDE PERIODIC PRICING OR VALUATION INFORMATION TO INVESTORS, MAY INVOLVE COMPLEX TAX STRUCTURES AND DELAYS IN DISTRIBUTING IMPORTANT TAX INFORMATION, ARE NOT SUBJECT TO THE SAME REGULATORY REQUIREMENTS AS MUTUAL FUNDS, OFTEN CHARGE HIGH FEES, AND IN MANY CASES THE UNDERLYING INVESTMENTS ARE NOT TRANSPARENT AND ARE KNOWN ONLY TO THE INVESTMENT MANAGER.
John Mauldin Archive |
© 2005-2022 http://www.MarketOracle.co.uk - The Market Oracle is a FREE Daily Financial Markets Analysis & Forecasting online publication.


