Crude Oil Spikes Like An Egyptian
Commodities / Crude Oil Jan 31, 2011 - 05:08 AM GMTBy: Dian_L_Chu
 Images of mass Egyptian protesters clashing with police in Cairo broadcasted around the world shook global financial markets on Friday, Jan. 28. Dow and S&P 500 both dropped more than 1%, while some asset classes such as gold, silver, U.S. Treasuries were hot commodities from safe haven demand.
NYMEX West Texas Intermediate (WTI) also spiked more than 4%, closing at $89.34, while ICE Brent crude for March delivery surged 2.1% to $99.42 a barrel, and touched $99.74 intraday, a new post-2008 high.

Egypt - Home of Two Oil Transport Chokepoints
If you are wondering the significance of Egypt related to the crude oil market. Here is a quick overview.
Egypt, with oil production of about 685,000 barrels of oil a day, is ranked in the top 30 among the world's oil producers, based on U.S. government data. The country is not a significant oil exporter as its production is mostly used for domestic consumption.
However, since Egypt is home to the two world oil transit chokepoints--Suez Canal and Sumed Pipeline--the surge in crude oil prices was partly on worries of potential supply transport disruptions.
Suez Canal Shutdown = Higher Oil Price
Suez Canal is a key water transportation lane between Europe, Middle East and Asia. An estimated 1.8 million barrels per day (b/d) of crude oil and refined petroleum products flowed through the Suez Canal, according to the U.S. EIA. The 200-mile long Sumed pipeline is an alternative to the Suez Canal for transporting oil with a capacity of around of 2.5 million barrels per day.
In the event that the canal is closed, thousands of ships and oil tankers would have to go around Africa, adding about 6,000 kilometers (3,729 miles) to their journey, slashing the availability, while adding to the cost of crude oil.
Increasing Middle East Tensions
Furthermore, since crude oil typically is very sensitive to geopolitics, markets are also nervous because the unrest in Egypt has raised tensions in the Middle East- the world’s major oil-producing region.
As riots first started in Tunisia, spreading to Yemen, and now Egypt, anger over rising prices and high unemployment has also prompted political protests erupting throughout the Arab world in Morocco, Algeria and Saudi Arabia.
Crude & Equities Diverge
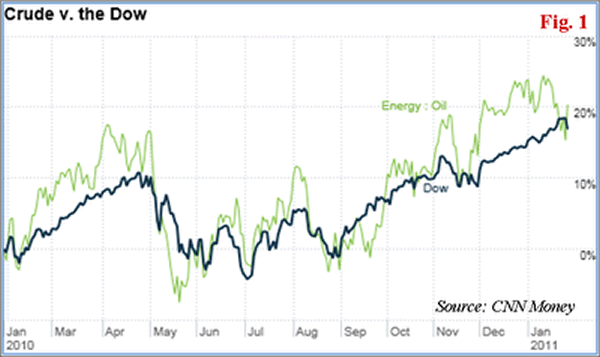
Crude oil and equities were mostly trending in tandem since the 2008 financial crisis on the prospect of global economic recovery. And geopolitical event tends to spur a broad market risk-off trade, i.e. selling off of equities and commodities like crude, going into bonds and dollar. However, since the situation in Egypt is very specific to the supply risk of crude oil, this time around, it is risk-off for stocks, but risk-on for crude, resulting in a divergence. (Fig. 1)
WTI-Brent Spread at Record High
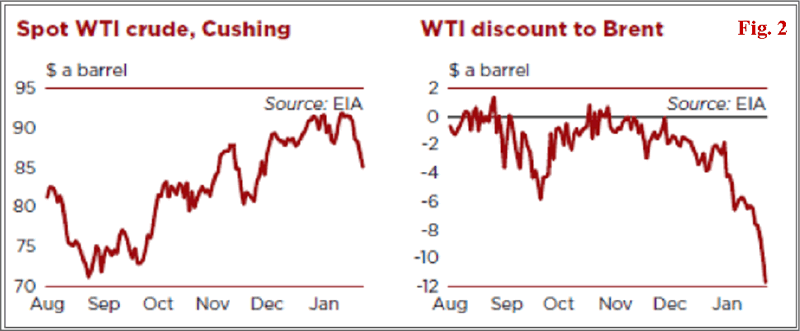
The North African turmoil also strengthened North Sea Brent Crude and widened its premium over WTI to a record $12.49 before ending the day at $10.08 (Fig. 2). Historically, WTI, a lighter and sweeter crude, has enjoyed a roughly $2 premium to the North Sean Brent.

This reversal and widening of the WTI-Brent price differential could be most attributed to seasonal and fundamental factors such outages at North Sea, cold weather in Europe, but more importantly is the “Cushing Syndrome.”
“Cushing Syndrome” Distorts WTI
Cushing, Oklahoma is a major crude oil trading hub and price settlement point for the NYMEX WTI. However, Cushing has a capacity and logistic problem, and the resulted land-lock tends to further exaggerate the already weaker U.S. demand, thus distorting against the WTI price. NYMEX WTI is also gradually losing its influence as global crude oil demand growth is shifting to Asia and away from the U.S.
Inventory at Cushing gained 2.3% in the week ended Jan. 21 to the highest since August, while the overall inventory in the U.S. also rose to 340.6 million barrels, 4.25% higher than a year ago, and above the 5-year average, according to the data from the U.S. EIA.
And the glut could get worse as TransCanada Corp.’s Keystone pipeline starts to pump as much as 156,000 barrels of Canadian crude to Cushing in February.
Lack of Transparency Boosts Brent
To be fair, with all the problems WTI seem to have (mostly associated with Cushing), Brent also has one unfair advantage over WTI which has helped boosting its price. That is, unlike the detail crude and product inventory report issued by the U.S. EIA weekly for the WTI crude, Brent does not have such (or any) reporting structure.
So, for all the criticism about WTI and that Brent is a better benchmark reflecting global demand, Brent could actually have been more easily manipulated to its current near $100 levels, due to its lack of transparency, and the considerably lower volumes on ICE (25% of NYMEX WTI, according to the CME Group as quoted by FT Alphaville.)
Higher Price = Better Benchmark?
I personally think most market players probably just pick whichever has the higher price point as being “the better gauge.” So, when the spread flips back to its historical pattern, either by the U.S. working off the excess at Cushing, or by some change of the WTI pricing structure, we could see headlines touting WTI as the better benchmark.
Fast & Furious WTI Short Squeeze
Meanwhile, the record differential has attracted some new spread traders piling into Brent, while shorting the WTI. Bloomberg reported that open interest for Brent futures rose to a record 968,565 on Jan. 21, based on data from ICE Futures Europe.
This not only further distorts the Brent and WTI differential, but also means a fast and furious short squeeze on the NYMEX WTI, with any unexpected events such as the Egyptian unrest. This is why you see WTI move 4% vs. the 2% of Brent on the same news.
Europe Is Not $12 Stronger
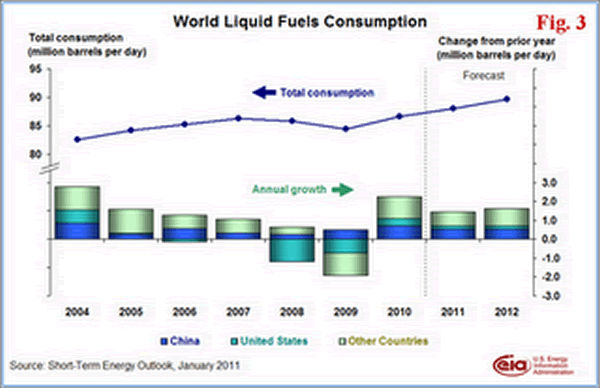
Moreover, the fact that the U.S. has more than sufficient crude inventory, a steady global product demand outlook (Fig.3), and plenty of OPEC spare capacity also suggest the world oil is currently well supplied, and there’s little reason Brent’s fundamentals should continue to be that much stronger than the WTI.

As such, I believe the current wide spread while partly supported by regional and seasonal market fundamental factors, is not sustainable.
Be A Brent Bear & WTI Bull
And with this new crisis in Egypt, shorts will likely come off on the WTI as nobody will be shorting crude anywhere, not even the WTI, regardless of the Cushing build. So, from what I've discussed here, I’d be more bearish on Brent and more bullish on WTI.
From that perspective, sometime in the next week or so, I expect WTI to break above $90 a barrel and could make a run at $93 as protests escalate, and Brent could break above $100. Meanwhile, the WTI-Brent spread will likely narrow to around $8 next week, and have the potential to move below $6 over the next few weeks, if chaos continues.
Crack Spread To Narrow Further
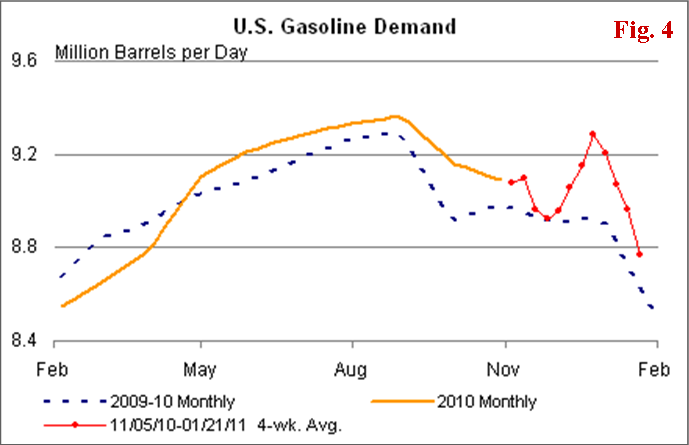
In the U.S., with both gasoline and distillate stocks continue to build and stay above the average range, and declining gasoline demand (Fig. 4), the independent refiners like Murphy Oil (MUR), Frontier Oil (FTO), Tesoro (TSO), will likely bear the brunt of this unexpected spike of crude prices further pressuring the crack spread.

Several U.S. refiners - Tesoro (TSO), Western Refining (WNR) and Alon USA (ALJ) each has short float of greater than 10%, while Valero (VLO) short float stood at greater than 20%.
Tanker Stocks Get An Egyptian Pop
Similar to Brent, shares of tanker lines like Frontline (FRO), Teekay Tankers (TNK), General Maritime (GMR), Overseas Shipholding (OSG), and Nordic American Tanker (NAT), also got a pop due to speculation that that tankers would be in high demand if the turmoil in Egypt causes the Suez Canal to close.
So far, the Canal has been operating normally since the riots started, and there’s no indication of a possible shutdown. Nevertheless, since it takes some time for portfolio managers to reallocate funds, and as long as the North African situation remains unresolved, there could be much more upside before the sector’s fundamentals set in again.
Among the tankers, Frontline (FRO), the world’s largest oil tanker operator, would be the best of the bunch from a risk/reward standpoint. I’d stay away from General Maritime (GMR) for the time being mainly due to its high leverage and its struggle with debt in recent months.
Start of a Political Shift in the Arab World
So far, the protests in Egypt seem to have no clear leader or organization, but could be ongoing for a while. For now, they have not spread into the major OPEC countries such as Saudi Arabia in a significant way; however, longer term, this movement could signal a change of political structures of possibly all Arab World in the years to come.
Priceless - Geopolitical Premium
Meanwhile, Bloomberg reported that oil options volatility increased to 30.1%, up 9% in one day as the underlying futures surged the most since Sep. 2009.
So, depending on the development in Egypt and the Middle East, volatility will likely rule crude oil in the near term as there has not been a geopolitical event such as this for a long time, and the “geopolitical premium” rises and falls based purely on markets’ “fear perception.”
Disclosure: No Postions
Dian L. Chu, M.B.A., C.P.M. and Chartered Economist, is a market analyst and financial writer regularly contributing to Seeking Alpha, Zero Hedge, and other major investment websites. Ms. Chu has been syndicated to Reuters, USA Today, NPR, and BusinessWeek. She blogs at Economic Forecasts & Opinions.
© 2011 Copyright Dian L. Chu - All Rights Reserved Disclaimer: The above is a matter of opinion provided for general information purposes only and is not intended as investment advice. Information and analysis above are derived from sources and utilising methods believed to be reliable, but we cannot accept responsibility for any losses you may incur as a result of this analysis. Individuals should consult with their personal financial advisors.
© 2005-2022 http://www.MarketOracle.co.uk - The Market Oracle is a FREE Daily Financial Markets Analysis & Forecasting online publication.


