Short-term Stock Market Top May Be Forming
Stock-Markets / Stock Markets 2011 Jan 31, 2011 - 03:32 AM GMTBy: Andre_Gratian
 Very Long-term trend - The very-long-term cycles are down and if they make their lows when expected, the secular bear market which started in October 2007 should continue until about 2014-2015.
Long-term trend -In March 2009, the SPX began an upward corrective move in the form of a mini bull market. Cycles point to a continuation of this trend.
SPX: Intermediate trend - The intermediate trend is still up and does not look in immediate danger of reversing. Last week's action suggests that a short-term top may be forming.
Analysis of the short-term trend is done on a daily basis with the help of hourly charts. It is an important adjunct to the analysis of daily and weekly charts which discusses the course of longer market trends.
Long-term analysis:
Ever since its intermediate low of 1011, the SPX has marched steadily upward. From the consolidation which took place just above 1173, we were able to derive a Point & Figure projection of approximately 1312 to determine how far the next move would carry.
Last Wednesday, the price moved up to 1299 and then started to trade in a narrow range, struggling to move higher. On Friday, there was an early attempt to resume the uptrend with the index reaching 1302.67 before giving up. From that point on it was downhill for the rest of the day with a close of 1276.38.
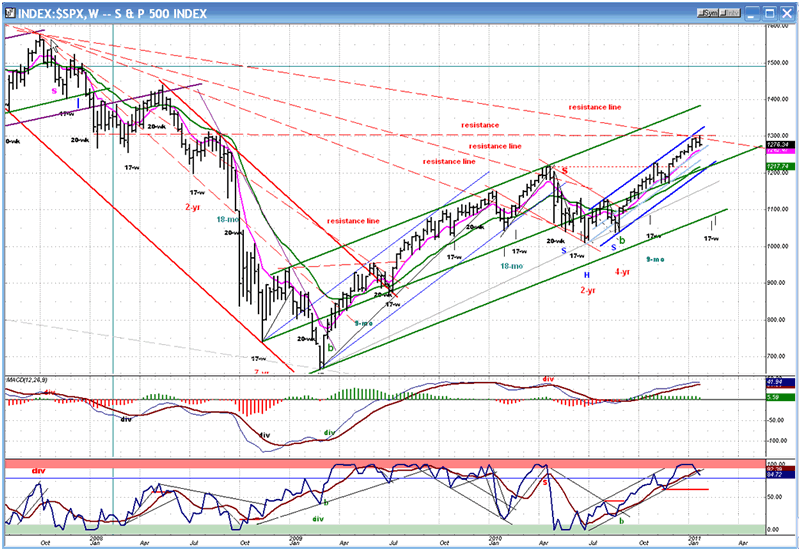
Have we finally made a short-term top? We won't know for sure until next week. There have been several indications over the past couple of weeks that one was near. The SPX had almost reached its projected target. The daily indicators had already given some fairly convincing sell signals. And, if you look at the Weekly Chart (below), you will see that we were coming into some resistance -- the intersection of a former resistance level with a long-term resistance line. All the dashed lines on the chart have been drawn using reference points from the long-term uptrend into the October 2007 top. They all provided temporary stopping points for the bull market advance. Perhaps the same thing is occuring here.
The struggle experienced by the SPX above 1995 looked very much as if short-term distribution was taking place -- another sign that we might be reaching a high point. Finally, the news from the Middle-East and the mass protests spreading from Tunisia to Egypt and other countries was the trigger which caused the dollar to bounce and to start the selling.
The weekly chart, so far, shows little damage to the intermediate trend. Last week's range consisted of a higher high and higher low than the previous week's. Also, there is no sign of deceleration in the trend with the index reaching very close to the top of its intermediate (blue) channel.
There is little deceleration showing in the indicators, as well. The MACD is just beginning to flatten out at a level which is well above its zero line. The MSO, which had been overbought for a month, has started to come down (but not from a position of negative divergence) indicating that a correction may be starting. We will try to assess how much of a pull-back lies ahead by looking at shorter-term charts.
Short-term projections and analysis
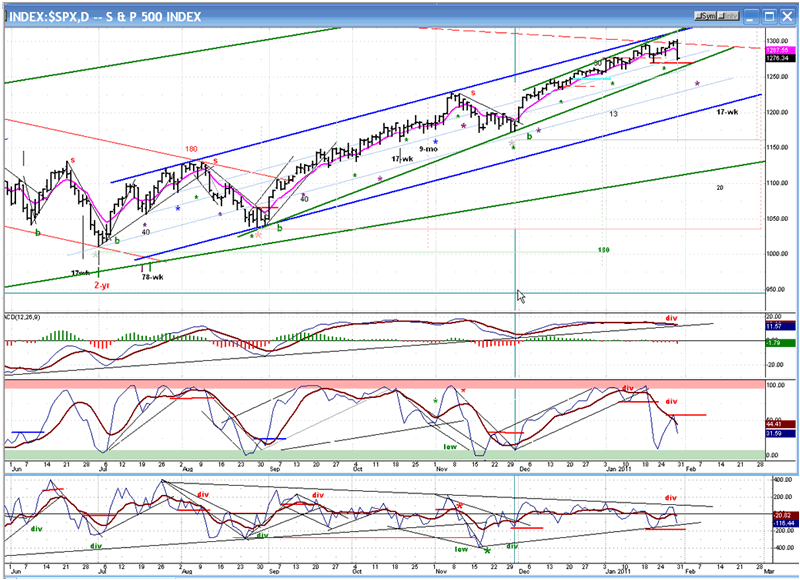
The Daily Chart (below) gives us a good look at the intermediate trend channel (blue) which started at 1041. I have also drawn the red-dashed resistance line mentioned above. This line could be one of the reasons why the SPX had a problem getting above 1300. Another was the negative divergence which had formed in the indicators, especially the middle one.
As of now, we still do not have a confirmed sell signal. Although this may be just hours or days away, the SPX will have to break below the red support line at 1271, as well as the green uptrend line which is drawn from the 1041 low, in order to indicate that a short-term top has been formed. It is no longer likely that a final move to 1312 will occur, but there could be a few more days of sideways trading above the trend line before prices break down. The small distribution pattern which formed between 1294 and 1302 only has a maximum projection of 1274 and, by the end of the day, on Friday, the index appeared to be making a small base. Unless the Middle-East events take a turn for the worse, there could be a time delay before the decline pushes lower.
Because of this possibility, I will be unable to estimate the extent of the decline using the P&F chart until the larger distribution process is complete and the SPX has traded below 1270.
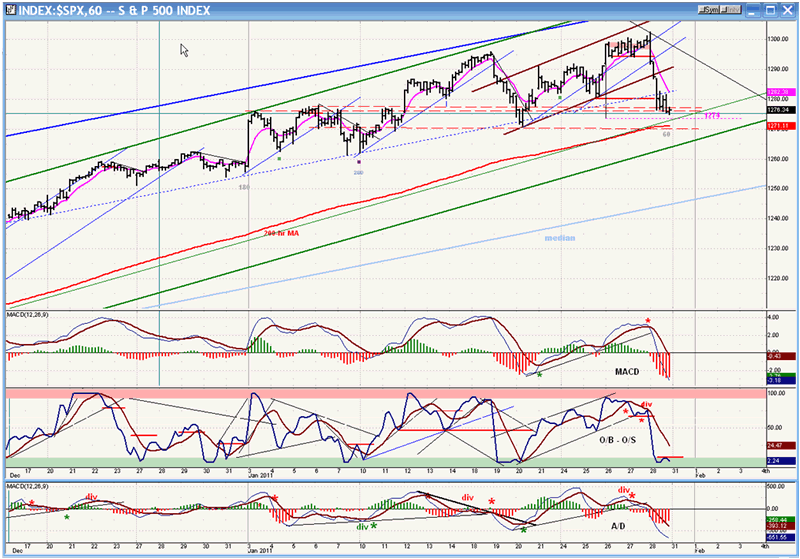
Let's now look at the Hourly Chart. (This is where you can see the value of keeping an hourly chart with good indicators.) The only existing ambiguity was in the top MACD which did not signal clear negative divergence. That was more than made up by the bottom oscillator of the A/D which, by Thursday, was telling us that things were getting a little dicey! The middle indicator was not exactly a paragon of strength, either.
As you will see in the sample updates below, the market action and the indicator readings concerned me enough to start warning my subscribers on Wednesday to be cautious. The sell signal came (and was communicated) when all the trend lines were broken, especially when the SPX moved out of its brown channel. As stated earlier, the small two-day distribution phase gives us a maximum projection of 1274, which I have marked on the chart. This corresponds to a support level derived from the former tops in early January, and the former low of 1271.26. We have experienced good support at 1262, but if we have to go that low to find it, we will already have broken the green trend line and the 200-hr MA. This would confirm that we have made a short-term top.
After the third hour of trading, on Friday, the SPX refused to sell-off much farther and started forming a little base which will either be expanded or penetrated on Monday morning. By far the biggest volume came in the third hour and it diminished substantially afterwards. A higher opening in the dollar on Monday may generate enough weakness to break support. If there is little weakness, we could extend the consolidation and even muster some retracement of the decline before moving lower.
Cycles
Several cycles are scheduled to make their lows in the second and third week of February, namely the 17-wk, 13-wk, 90-day, and 180-day. These could prove to be the magnets which attract prices into that time period.
Breadth
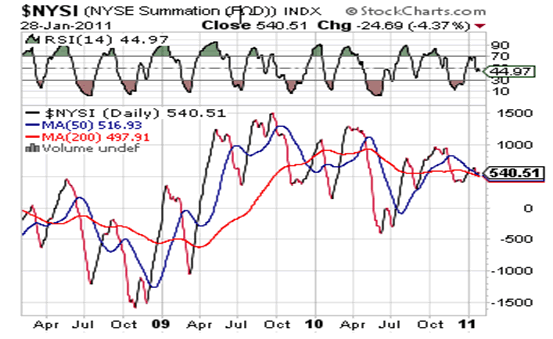
Since its high of September 2009 (when it became extremely overbought), the NYSE Summation Index (courtesy of StockCharts.com) has been declining gradually. This is more of a normalization process than a sign of weakness. However, since June 2010 the pattern reveals that intermediate deceleration is setting in, and the last few weeks show some obvious negative divergence. This is a warning that we are coming into some kind of a top, reinforced by the fact that the RSI was unable to reach its normal rally height on the last up-move, and has already started down.
Sentiment
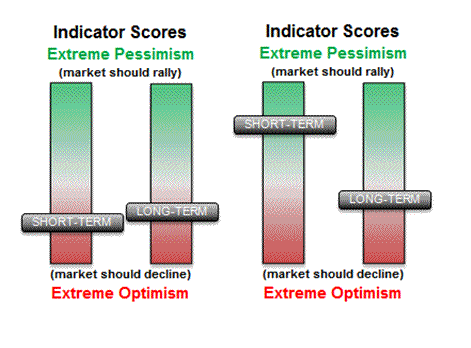
I have learned to respect the signals given by the SentimenTrader (courtesy of same) and, below, we can compare Friday's reading vs. that of two weeks ago. Improved bullishness is very obvious, especially in the short term. This indicator is telling us that the market may not exactly be ready to fall out of bed.
Caveat bears
Dollar index
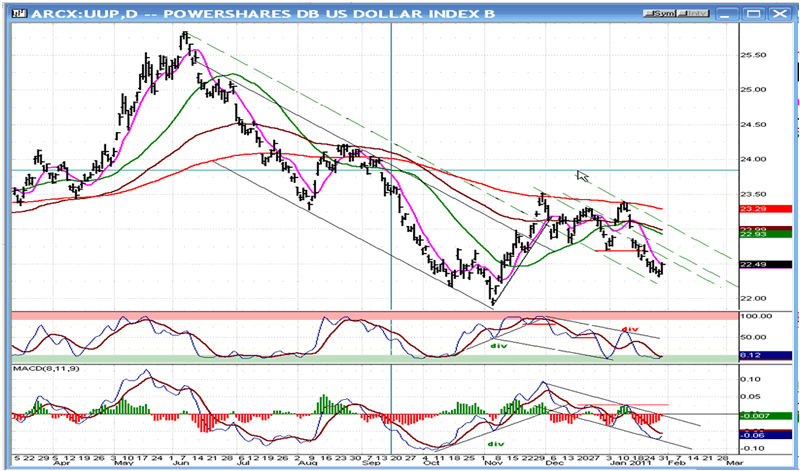
The indicators of the dollar ETF (UUP, above) had achieved oversold positions and were ready for a bounce. Concern about stability in the Middle-East provided that opportunity. That does not mean that this index is ready for an extended uptrend. There is no divergence in the indicators, and the UUP is still a long ways from suggesting that it is ready to break out of its downtrend. Although the bounce could be extended, it is not yet likely to result in a full-scale reversal.
The P&F chart continues to suggest that an important base may be under construction, but more work needs to be done.
Gold
Because it is traded mostly by professionals, gold's line charts are the easiest to analyze, and this goes double for the P&F chart (providing you know what you're doing J). This is why P&F projections need to be respected.
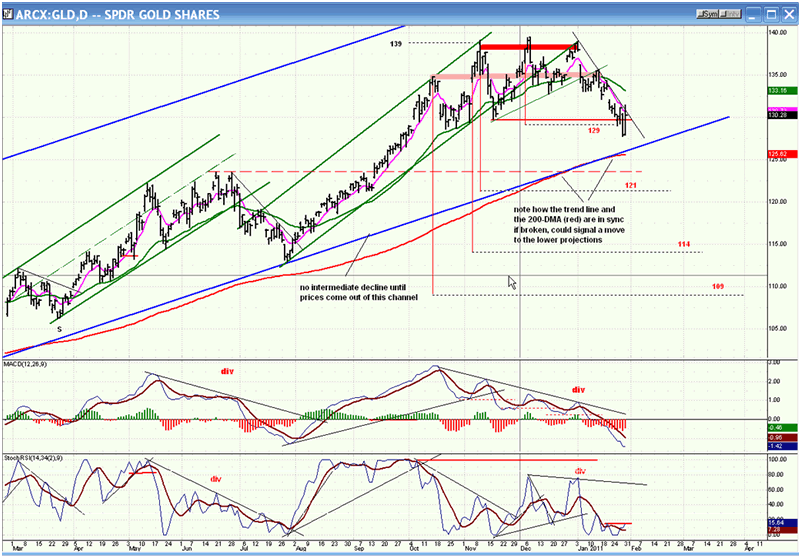
Below is a daily chart of the gold ETF (GLD). After reaching an important projection at 139, the index made a terminal distribution pattern which resulted in some well-defined P&F counts. The absolute minimum one taken across the first two tops from the right was 129 and it has already been surpassed. This is a sign of weakness suggesting that the next projection (119-121) has a good chance of being reached.
Because of the chart structure, it is probable that the blue intermediate trend line will be broken. The lower indicator is oversold and signals a potential bounce, but the MACD is in a steep downtrend which has already surpassed the July low and shows no sign of having bottomed. Until we see some better price and indicator action, the ETF is vulnerable to declining to its lower targets.
Top distribution phases and P&F projections have been identified on the chart.
Summary
The market may be at an important short-term juncture. Friday's sell-off, after the SPX had reached the last interim target of 1301 -- very near to its projected final destination of 1310-1312 -- could mean that the end of the rally from 1173 (and perhaps from 1041) has taken place.
It is important to let the market speak for itself and not to jump to premature conclusions. As of Friday's close, only a near-term (interim) sell signal had been given. More weakness and a daily close below 1270 will be needed to signify that a short-term top has been reached.
FREE TRIAL SUBSCRIPTON
If precision in market timing for all time frames is something which is important to you, you should consider a trial subscription to my service. It is free, and you will have four weeks to evaluate its worth.
For a FREE 4-week trial. Send an email to: ajg@cybertrails.com
For further subscription options, payment plans, and for important general information, I encourage you to visit my website at www.marketurningpoints.com. It contains summaries of my background, my investment and trading strategies and my unique method of intra-day communication with Market Turning Points subscribers.
By Andre Gratian
MarketTurningPoints.com
A market advisory service should be evaluated on the basis of its forecasting accuracy and cost. At $25.00 per month, this service is probably the best all-around value. Two areas of analysis that are unmatched anywhere else -- cycles (from 2.5-wk to 18-years and longer) and accurate, coordinated Point & Figure and Fibonacci projections -- are combined with other methodologies to bring you weekly reports and frequent daily updates.
“By the Law of Periodical Repetition, everything which has happened once must happen again, and again, and again -- and not capriciously, but at regular periods, and each thing in its own period, not another’s, and each obeying its own law … The same Nature which delights in periodical repetition in the sky is the Nature which orders the affairs of the earth. Let us not underrate the value of that hint.” -- Mark Twain
You may also want to visit the Market Turning Points website to familiarize yourself with my philosophy and strategy.www.marketurningpoints.com
Disclaimer - The above comments about the financial markets are based purely on what I consider to be sound technical analysis principles uncompromised by fundamental considerations. They represent my own opinion and are not meant to be construed as trading or investment advice, but are offered as an analytical point of view which might be of interest to those who follow stock market cycles and technical analysis.
Andre Gratian Archive |
© 2005-2022 http://www.MarketOracle.co.uk - The Market Oracle is a FREE Daily Financial Markets Analysis & Forecasting online publication.


