


U.S. Bond Markets Deflation Whispers
Interest-Rates / Deflation Jan 29, 2011 - 12:55 PM GMTBy: Brian_Bloom

 In an inflationary environment, the longer dated yields should be in a bull trend relative to the shorter dated yields – because the time value of money rises in periods of inflation. Conversely, when there is deflation then money in the future is worth less than cash in the hand. Therefore the ratio should fall if deflation is being anticipated.
All charts below are courtesy of stockcharts.com
Explanation:
In Point and Figure Charts the “x” column represents rising prices and the “o” column represents falling prices. (In the analysis below yields on treasury instruments are charted as if they were the price of money).
With a 3% X 3 box removal scale – a scale chosen to eliminate trading noise - moves of 3% within an established bull trend are recorded as an “x”. Counter trend moves are marked with an “o” only once a cumulative “reversal” of 3 boxes is experienced. This 9% counter trend move is then regarded as a trend change and will be regarded for charting purposes as an established bear trend. “Time” is not a consideration in this method of charting although dates may be included as reference points.
So, for example, on a spectrum of 1-100 and assuming the price starts of at 100
- Assuming an established bull trend, a rise of 3 will be recorded by one “x”
- If prices fall by a minimum of 3 X 3 = 9 then that fall of 9 will be recorded by a falling column of three “o” ‘s and, going forward, the established trend will be regarded as bearish
- If prices fall by a further 3% then an additional o is inserted.
- If prices rise by (say) 6 or 7 then nothing is recorded because we need a minimum of 9% move (3 % X 3) for a trend change.
The following four Point and Figure charts (3% X 3 box reversal) are:
- 30 year yield divided by 10 year yield ($tyx:$tnx)
- 10 year yield divided by 7 year yield ($tnx:$ust7y)
- 7year yield divided by 5 year yield ($ust7y:$fvx)
- 10 year yield divided by five year yield ($tnx:$fvx)
Note the subtleties:
The first three are still in bull trends (indicating inflation anticipated) but the zeros are close to their rising trend lines (indicating that the fear of inflation is receding and the fear of deflation is building)
The last one (#4) has actually broken down and is now in a falling trend (below a falling red line) – indicating that deflation is being anticipated.
The above speaks of two different types of trends. For example, a rising column of x’s which are recorded below a falling red trend line can be regarded as a technical reaction within a prevailing bear trend.
Chart 1:
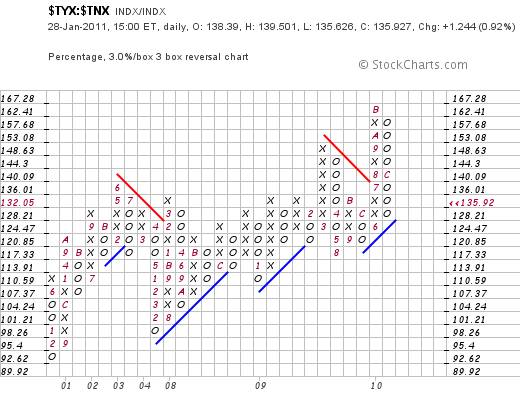
Chart 2:
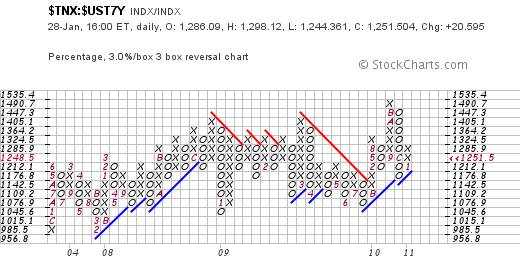
Chart 3:
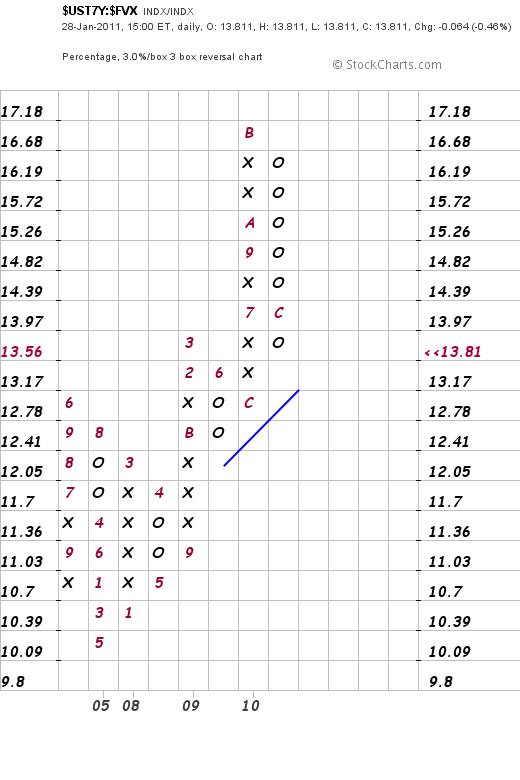
Chart 4:

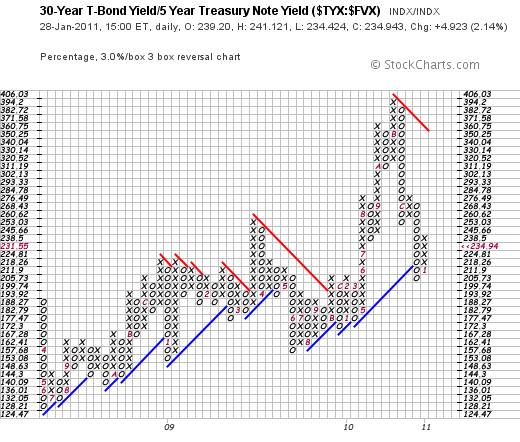
Finally, to get a relative picture of thirty year yields divided by five year yields, have a look at the chart below. Note the fact that the dominant trend line is the descending red one even though the most recently entered column is a column of x’s.
Chart 5:
Conclusion
It’s subtle, but the bond markets are “whispering” that deflation may be a more likely outcome than inflation.
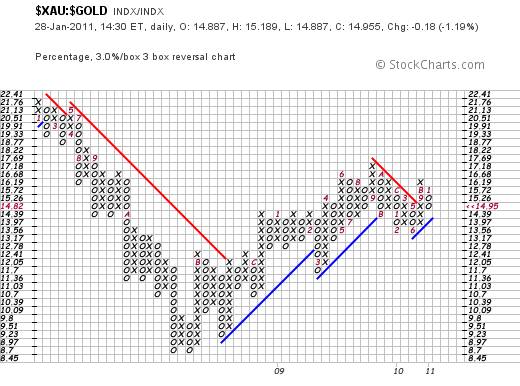
This whisper is quietly being confirmed by the chart below of the ratio of the gold shares ($xau) divided by the gold price, but the scale of this chart is too short. We need to wait for the 3% X 3 box reversal chart of the $XAU:$GOLD ratio to give a sell signal to conclude that the gold price can be anticipated to fall significantly. That will happen if the ratio falls below 13.97:
Chart 6a:
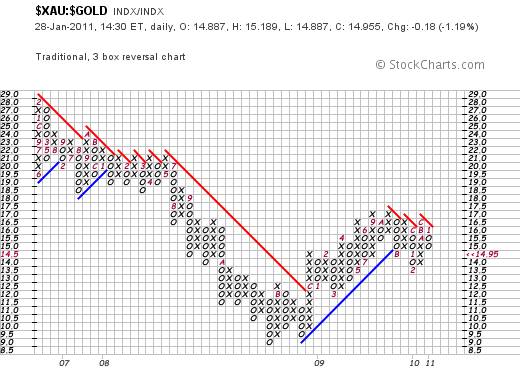
Chart 6b:
Overall Conclusion
The whispers are soft – like the first zephyr breezes that precede the coming storm.
To get some perspective, have a look at the Point and Figure Chart of the gold price itself:
Chart 7:
Today’s bounce was insufficient to be regarded as a trend change to justify entry of x’s.
Support is at $1290 an ounce. A fall below that level will represent a short term breakdown.
Analyst Comment
Will the gold price break below $1290?
That’s a difficult question to answer, but the “traders” seem to think it’s possible – which is why the ratio of the $xau divided by the gold price is being reflected as a column of o’s edging below its falling red trend line. However, those who are committed to gold are not yet of the same view – as validated by the dominance of the rising blue trend line on the 3% X 3 box reversal – above which the falling column of o’s is still intact.
….. and then (from a fundamental perspective) there are the Republicans in Congress who are wanting to cut the budgeted expenditure by over $2 trillion – which will have a significantly deflationary impact.
Will they follow through with this action?
Watch the charts. If they are used like a doctor watches temperature and blood pressure, then they are able to give clues as to the overall health of the markets. Right now, the signs are that the patient’s fever may be breaking. The fever that arguably gave rise to the patient’s hysteria which, in turn, is arguably what ultimately caused the sharp upward reaction within the Primary Bear Market, may be abating. If/when the fever breaks, rational thought will once again prevail.
And, if sanity returns in a rush, then we can expect a train smash in the financial markets when people start to ask themselves “what the hell was I thinking!?”
Look at it in this light:
If you believe that in an environment where:
- unemployment and underemployment together are approaching 20%; and
- where the interest burden on US public debt is approaching $700 billion (half the projected budget deficit), and
- where the Baltic Dry Index has fallen from a peak of 11,709 on May 19th 2008 and which now stands at 1,186 (90% off its peak)
that pumping liquidity into the market will “fix” the economy ….
then I’ve got this slightly ageing bridge in Brooklyn that I can let you have at a bargain basement price. It will very likely become a collector’s item one day and, because it’s a tangible asset, it will almost certainly retain its value in an inflationary environment.
Dear reader, not even if Ben Bernanke was as bright as Albert Einstein , Isaac Newton and Stephen Hawking all rolled into one, could he succeed in making a silk purse out of a sow’s ear.
So what should we be doing about all this?
Via the storyline of The Last Finesse, the reader is taken through the logic of why structural changes in the way we manage society are needed and a strong (and pragmatic) recommendation is made as to what (arguably) the most important of those changes should be.
If you are interested in acquiring a copy (the 40+ chapter manuscript is targeted for completion in April 2011) please email me with contact details and specify if you have a preference for a hard copy or an e-book.
Finally, a word of caution: Even if the gold price falls, the targeted destination for its price move (based on charting theory) will still be above its long term rising trend line. Gold is not for trading. It is an asset which acts as an insurance policy against inflationary times and which retains its value in deflationary times. Personally, I don’t believe that gold will ever again be regarded as money. But that’s another story …
By Brian Bloom
Once in a while a book comes along that ‘nails’ the issues of our times. Brian Bloom has demonstrated an uncanny ability to predict world events, sometimes even before they are on the media radar. First he predicted the world financial crisis and its timing, then the increasing controversies regarding the causes of climate change. Next will be a dawning understanding that humanity must embrace radically new thought paradigms with regard to energy, or face extinction.
Via the medium of its lighthearted and entertaining storyline, Beyond Neanderthal highlights the common links between Christianity, Judaism, Islam, Hinduism and Taoism and draws attention to an alternative energy source known to the Ancients. How was this common knowledge lost? Have ego and testosterone befuddled our thought processes? The Muslim population is now approaching 1.6 billion across the planet. The clash of civilizations between Judeo-Christians and Muslims is heightening. Is there a peaceful way to diffuse this situation or will ego and testosterone get in the way of that too? Beyond Neanderthal makes the case for a possible way forward on both the energy and the clash of civilizations fronts.
Copies of Beyond Neanderthal may be ordered via www.beyondneanderthal.com or from Amazon
Copyright © 2011 Brian Bloom - All Rights Reserved
Disclaimer: The above is a matter of opinion provided for general information purposes only and is not intended as investment advice. Information and analysis above are derived from sources and utilising methods believed to be reliable, but we cannot accept responsibility for any losses you may incur as a result of this analysis. Individuals should consult with their personal financial advisors.
Brian Bloom Archive |
© 2005-2022 http://www.MarketOracle.co.uk - The Market Oracle is a FREE Daily Financial Markets Analysis & Forecasting online publication.