


Weekly Gold and Silver Technical Analysis Report - Surge in Shorts Open Interest Trying to Cap Golds Bull Run
Commodities / Gold & Silver Oct 28, 2007 - 12:50 PM GMTBy: Merv_Burak

 Wow! what a week. It starts with a plunge and ends with a zoom. Which, oh which is the REAL direction of least resistance?
SHORTS
If that open interest is mostly shorts, someone is sure set on losing their shirts. They've added another 16000 short contracts this past week and that's not including Friday. I'll bet that the open interest really moved on Friday. All that money trying to cool the bullish run on gold. Who, oh who could be that speculative to be risking all that capital on the short side when the strength is on the up side? Unless – maybe the shorts are not playing with their own personal money.
I finally got it right, it's www.gata.org . And I double checked it just to be sure.
GOLD : LONG TERM
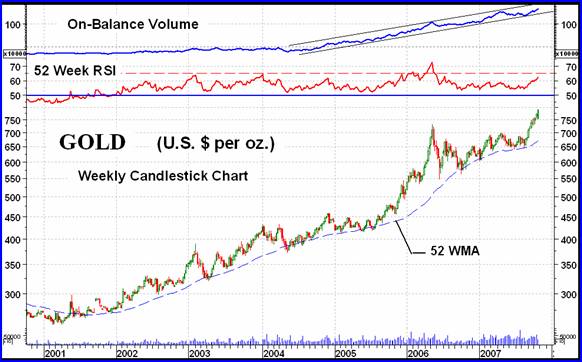
A technician has many choices when displaying a chart. Geometric or semi-log scale? Weekly or daily action, or monthly? What kind of moving average, if any? And what indicators to show, if any? The choices a technician makes usually depends upon the story he wishes to portray. The chart this week is intended to show what I refer to as the very long term trend starting with the 2001 bottom. What we see here is a continuous bullish trend with a yearly moving average (52 week simple moving average shown) that has remained sloping in an upward direction ever since it turned up in late 2001, signaling a new bull market. We also have a very long term momentum indicator (52 week RSI shown) that has continued to confirm the positive moving average line by staying in its positive zone (above the 50% neutral line).
We also have an interesting cumulative volume line (the On-Balance Volume). It's interesting for two points. First, you may remember that I have often referred to the volume indicator as under performing, not keeping up with the price. Well that is true on a daily chart. On this weekly chart the indicator looks totally different, and quite positive. It was really not doing much until 2004. Then it took off and has been going gang-busters ever since. On a daily chart the indicator has been moving sideways for the past year and a half. Only a couple of weeks ago it was below its level of the May 2006 top. The weekly indicator is telling us a different story. It is well above its May top and continues inside a strong up trending channel that has trapped the indicator since it started its strength in 2004. What to make off all this?
From a very long term perspective we are far from confirming any reversal to the bear. Market tops can occur anytime but to confirm a reversal requires time in the reverse direction to be able to change the indicators. That is not in the cards in the foreseeable future.
From the normal long term perspective all seems well. The price remains above a positive sloping moving average line with a momentum that continues to move higher in its positive zone. The volume indicator is above its long term trigger moving average line and pointing higher. All seems well with the long term world. The rating can only remain BULLISH.
INTERMEDIATE TERM
We can cover the intermediate term by simply repeating what was said for the long term. All continues to look good and the intermediate term can only be rated as BULLISH.
SHORT TERM
We had a rough Monday with quite a plunge in price. There was a hint that the plunge would turn around. On the candlestick chart an empty body means that the closing price was higher than the opening price. This is usually found in an up trend with the green candles signifying an up day. However, it is unusual on down days with red candles. A red candle indicates that the closing price was lower than the previous close. The open body indicates that the closing price was higher than the opening price. One can surmise from this that the market was weak at the open but strengthened near the close and usually infers a continuation of the strength into the next day or more. The circles indicate the days we had this situation. Each had a follow on up day and all except for one had significant upside action after. One would then not have panicked on Monday with such action, expecting a reversal the following day, which was correct. I had this same situation occurring in my Daily Uranium Chart (see www.techuranium.blogspot.com ) on Monday, with the same result.
Well, that was then, how about now? The price trend is still quite positive and I like the close on Friday at the top of its trading range. Momentum is lagging a little behind the price action and is once more entering its overbought zone. The more aggressive Stochastic Oscillator has also sneaked into its overbought zone. Sneaking into the overbought zone is not a problem, it is when the indicators turn around and move back below the overbought line that one needs to be on alert. For now everything is in order and there is no reason, technically, to think that a serious reversal is just about to occur. Go with the trend, which remains BULLISH. A reversal of short term trend will not occur until the price drops below the short term moving average line (15 DMAw) and the line turns down. A confirmation would be when the very short term moving average line (8 DMAw) drops below the short term line.
NORTH AMERICAN GOLD INDICES
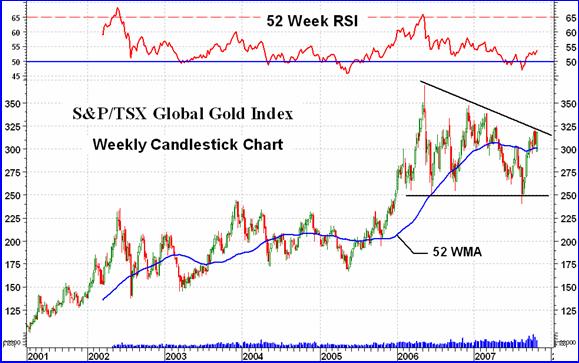
Of the five major Indices that I review here in rotation the S&P/TSX Global Gold Index is the weakest of the bunch. It is nowhere near its previous high while the other Indices have exceeded their previous highs. I guess that changing the Index from a Toronto Index to a “Global” one, primarily with additional stocks traded in the U.S. , hasn't really done the Index much good. The difference in performance can't even be placed on currency fluctuations.
All the indicators are positive, even for the very long term. The watch and wait is now to see if the Index will breach that upper down trend line of a pennant pattern. These patterns often occur mid way through a trend and are generally a bullish pattern when the “flag pole” of the pennant was a bullish move. Should the trend line be breached that would then set a projection, based upon this pattern, to the 440 mark. Let's wait for it.
The one very bullish Global Gold indicator is the volume indicator. The cumulative volume is very positive, making new highs and acting very strong. This suggests that the Index itself is not telling us the whole story. It seems that investors are very positive on stocks in this Index.
MERV'S PRECIOUS METALS INDICES
Except for the Johannesburg Index and the U.S. Dollar, all the other Indices in the Precious Metals Table had a pretty good week. In general the gains were in the 3% to 5% range with the Merv's Gamb-Gold Index coming in with a 5.7% gain. The Composite Index is once more into new high territory but without confirmation from the momentum indicator. Looking at the long term momentum we see that it is at the 60% mark, a level it has been at several times in the past year and a half. Although positive, it must breach this level to show that it is gaining strength, not just holding on to what it had before. The same can be said for the intermediate term momentum. Despite this lack of increased strength in the momentum indicators, both time periods can still be rated as BULLISH for the overall precious metals worlds.
Subscribers to the Merv's Precious Metals Central will note that the charts published with this week's various tables of technical information and ratings are very long term charts with a 52 week simple moving average and a 52 week RSI (similar to the very long term gold chart at the start of this commentary). Each starts at the beginning of their bull market (if the Index has such historical data) up to the present and includes the Index value at the start and on Friday for performance information.
MERV'S GOLD & SILVER 160 INDEX
This week the 160 Index is still based upon the existing stocks. Next week we will have a complete upgrade to the component stocks ready and being used. The average stock in the universe had a gain of 3.3%, near the lower end of most of the Indices. From a review of the various Indices it is obvious that this week it was the higher “quality” stocks that held back the Index performance. Still, the Index is performing quite well. Although not yet in new high territory it is higher than its May 2006 high. We had higher highs in this Index earlier this year that still have to be overcome. Needless to say, both the intermediate and long term moving averages are positive as are the momentum indicators. As with the composite Index the momentum indicators are not showing increased strength versus previous rallies but still they are positive.
As for the breadth of the market, there were 119 stocks on the up side (74%), 31 stocks on the down side (19%) and 10 stocks unchanged. The summation of individual stock ratings were bullish for all time periods indicating a BULL market in progress. The short term was 61% BULL, the intermediate term was 79% BULL and the long term was 57% BULL.
Although gold bottomed out in early 2001 (see chart above) the universe of 160 stocks actually bottomed out about a year and a half earlier and had already rallied almost 200% before gold bottomed. As the chart shows, the universe has since gained 6400% . Not bad for an average performance of 160 stocks.
From all of the above one can only rate all investment time periods as BULLISH at this time.
MERV'S QUAL-GOLD INDEX : MERV'S SPEC-GOLD INDEX : MERV'S GAMB-GOLD INDEX
The Qual and Spec Indices have been upgraded and are posted this week. The Gamb-Gold Index will be completed next week. What I've found is that the higher the “quality” of the Index the less changes there were to the component stocks.
While last week we had no pattern to the gains in the three sector Indices this week we see the pattern of higher “quality”, lower performance. The Qual-Gold Index gained 3.9%, the Spec-Gold Index gained 5.2% and the Gamb-Gold Index gained 5.7%. Although the Gamb-Gold Index had the better performance it did so with the lowest number of winning stocks. The Advancing to declining stocks in each Index looks like this: Qual -– 27 to 10, Spec –- 27 to 2 and Gamb –- 21 to 7. Without going into details, this week all three Indices have their summation of individual stock ratings in very high BULLISH territory for all three time periods, except for the Gamb-Gold long term which is NEUTRAL.
The Qual-Gold Index chart shows the bottom of the market in late 2000, a few months before the gold bottom. The performance since the bottom has been an advance of 644% , not bad for the “quality” stocks.
The Spec-Gold Index also had its bottom in late 2000 with a subsequent performance of 4076% .
The Gamb-Gold Index bottomed out just before the end of 2000 and has had a very good performance since then, with a gain of 7790% .
SILVER
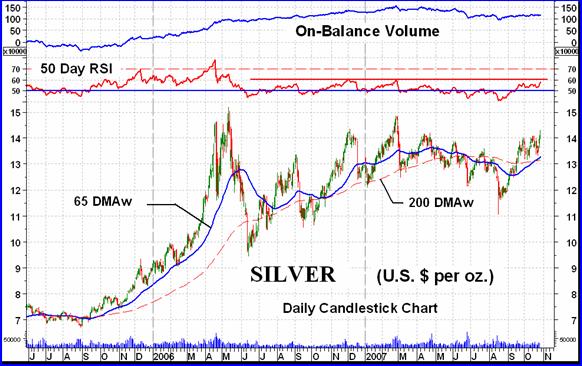
Silver has not yet recovered from its May-June 2006 plunge but appears ready to do so. This past week it out performed gold by better than two to one margin, gold with a 2.4% advance and silver with a 5.2% advance. However, silver still has a long way to go. Over the past several months the volume of trading has been decidedly on the down side. We now need that volume action to reverse and get the volume indicator back on track. Without the speculative interest in silver with that increased upside volume action any silver move on the up side will have limited longevity.
MERV'S QUAL-SILVER INDEX : MERV'S SPEC-SILVER INDEX
The silver Indices did not do as well as might be expected with a 5.2% silver move. Usually one would expect a percentage move a lot higher with the Indices. This did not happen. The Qual-Silver Index gained 4.1% while the Spec-Silver did a little poorer at 3.4%. Having said that, both are still in BULLISH mode but below previous highs.
The Qual-Silver had 9 stocks on the up side (90%) and one on the down side (10%). The Spec-Silver had16 stocks on the up side (64%) and 8 on the down side (27%). All three time periods for both Indices are in the BULLISH camp as far as the summation of individual ratings are concerned.
The Qual-Silver Index did not start its bull market move until late in 2001, almost a year after gold started. Since then it has advanced by 1567% .
Unfortunately my Spec-Silver Index does not go back far enough to catch the start of its bull market. The Index starts at the beginning of 2003 and has since climbed 1453%.
Merv's Precious Metals Indices Table
Well, that's it for this week.
By Merv Burak, CMT
Hudson Aero/Systems Inc.
Technical Information Group
for Merv's Precious Metals Central
Web: www.themarkettraders.com
e-mail: merv@themarkettraders.com
During the day Merv practices his engineering profession as a Consulting Aerospace Engineer. Once the sun goes down and night descends upon the earth Merv dons his other hat as a Chartered Market Technician ( CMT ) and tries to decipher what's going on in the securities markets. As an underground surveyor in the gold mines of Canada 's Northwest Territories in his youth, Merv has a soft spot for the gold industry and has developed several Gold Indices reflecting different aspects of the industry. As a basically lazy individual Merv's driving focus is to KEEP IT SIMPLE .
To find out more about Merv's various Gold Indices and component stocks, please visit www.themarkettraders.com and click on Merv's Precious Metals Central . There you will find samples of the Indices and their component stocks plus other publications of interest to gold investors. While at the themarkettraders.com web site please take the time to check out the Energy Central site and the various Merv's Energy Tables for the most comprehensive survey of energy stocks on the internet. Before you invest, Always check your market timing with a Qualified Professional Market Technician
Merv Burak Archive |
© 2005-2022 http://www.MarketOracle.co.uk - The Market Oracle is a FREE Daily Financial Markets Analysis & Forecasting online publication.