


Global Stock Markets Over Extended and Running Out of Steam
Stock-Markets / Stock Markets 2011 Jan 24, 2011 - 05:18 AM GMTBy: Garry_Abeshouse

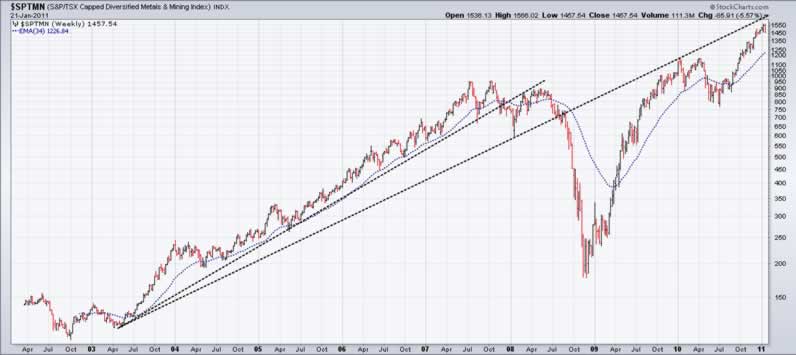
 First cab off the rank and probably one of the biggest bull markets ever experienced in a western equity market index over a two year period in the history of the stock market, would have to be the Canadian TSX Mining Index, which rose from 177 to 1568, a rise of 786% since November 2008.
By comparison, the Sydney Metals and Minerals index rose from 370 in 1959 to around 5400 in January 1970 – a rise of 1360% over the last 11 years of Australia’s mining boom.
The blow-out in the TSX Index since September 2010, is not unlike the one experienced in Australia during the tail end of the Poseidon Nickel Boom in the second half of 1969. Both blow outs coincided with key metal prices at or near all time high, as well as coinciding with bearish speculation on the USD.
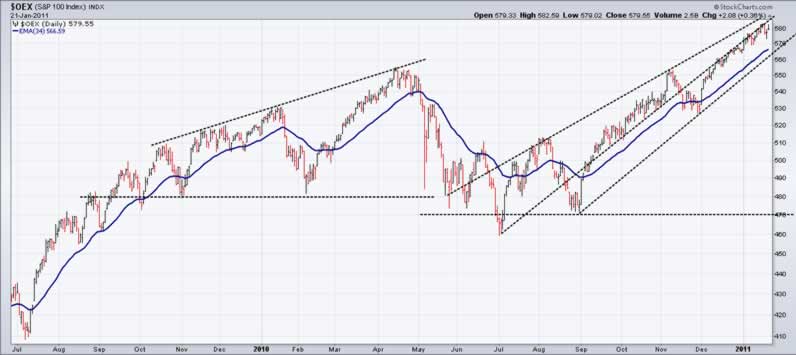
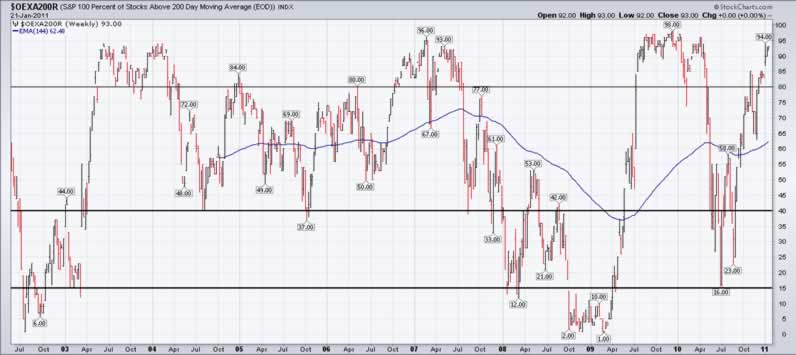
The USA S&P 100 Leaders Index is also looking very over extended as the two charts below show. The upward wedge has extended into the apex with a low momentum and low volatility rise since the beginning of December, extending only about 5.5% over the April 2010 high. The second weekly chart shows the index is in heavily over extended territory for only the third time in 8 years.
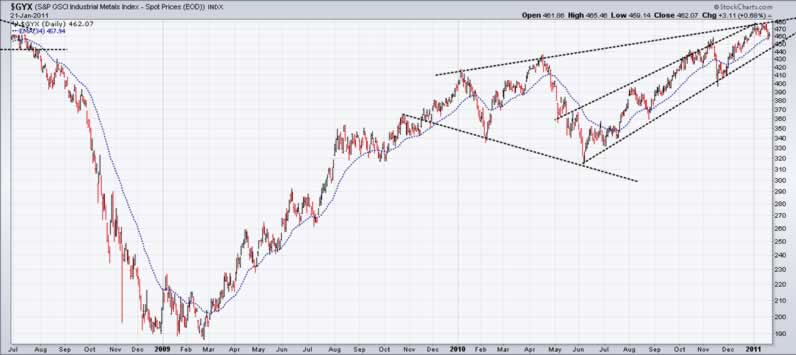
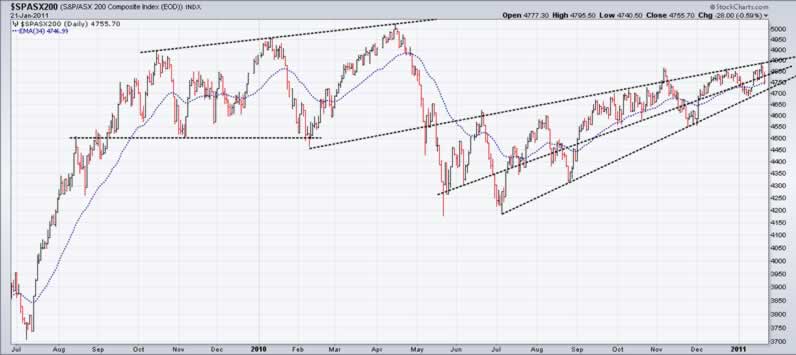
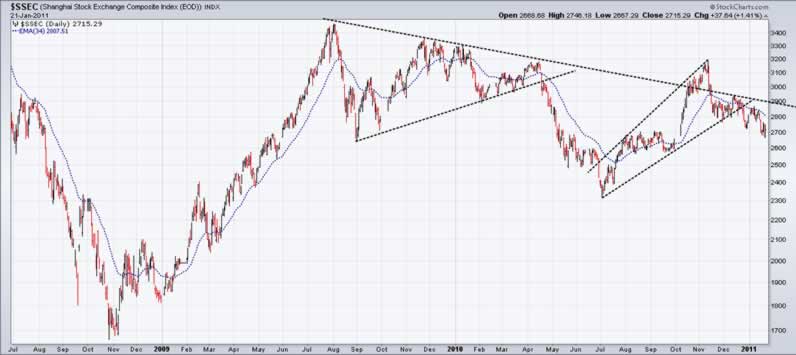
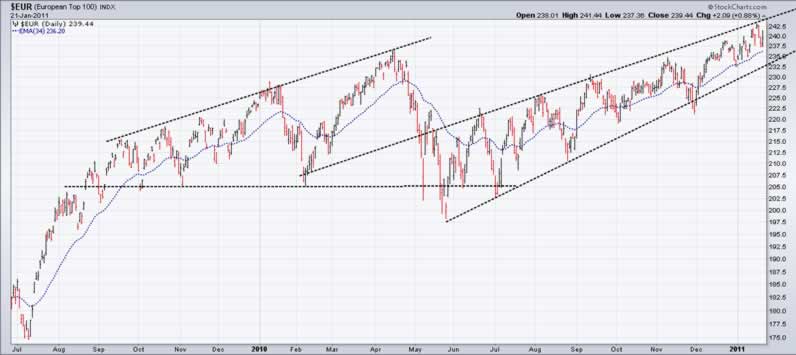
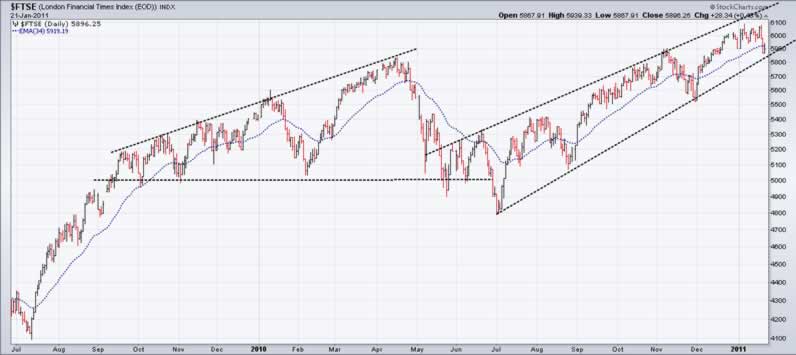
The Sydney ASX 200 Index is sensitive to more downside pressure on any further weakness in Industrial Metals prices and the Shanghai Index. It is interesting that the Sydney ASX 200, the European 100 Index, London FTSE and the S&P 100 – all show similar broadening and upward wedge patterns, all with bearish connotations.
Till next time.
Garry Abeshouse
Technical Analyst.
Sydney
Australia
I have been practicing Technical Analysis since 1969, learning the hard way during the Australian Mining Boom. I was Head Chartist with Bain & Co, (now Deutsch Bank)in the mid 1970's and am now working freelance. I am currently writing a series of articles for the international "Your Trading Edge" magazine entitled "Market Cycles and Technical Analysis".
I have always specialised in medium to long term market strategies and after discovering the excellent Point & Figure Charts from Stockcharts.com in mid 2008, have concentrated on this style of charting ever since.
© Copyright Garry Abeshouse 2011
Disclaimer: The above is a matter of opinion provided for general information purposes only and is not intended as investment advice. Information and analysis above are derived from sources and utilising methods believed to be reliable, but we cannot accept responsibility for any losses you may incur as a result of this analysis. Individuals should consult with their personal financial advisors.
© 2005-2022 http://www.MarketOracle.co.uk - The Market Oracle is a FREE Daily Financial Markets Analysis & Forecasting online publication.