


Shanghai Interbank Offered Rate Soars to 7.5%, Could Trigger Stock Market Flash Crash
Stock-Markets / Financial Markets 2011 Jan 23, 2011 - 01:03 AM GMT

 The FDIC Expands the Problem Bank List.
The FDIC Failed Bank List announced four new bank closures this week. The FDIC said in November that its list of “problem” banks -- those at heightened risk of failure -- grew by 3.7 percent to 860 in the third quarter, the most in 17 years. Banks on the confidential list had $379.2 billion in assets as of Sept. 30, down from $403 billion three months earlier.
SHIBOR: We Have A BIG Liquidity Problem
(ZeroHedge) When two weeks ago we first pointed out the surging Chinese weekly SHIBOR (following up on comparable observations from last summer) it prompted a variety of bemused responses, the bulk of which were of the now traditional "this is irrelevant" variety. Too bad. Today, the 7 day SHIBOR (and repo rate) has just surged to new multi-year highs and has literally exploded from 2.5% to 7.3% in a few short days. Two weeks ago we said: "In a nutshell: there is no marginal liquidity left in the world's fastest growing economy. Eventually this will dawn on the world. Until then, BTFD." Looking at the SHCOMP's performance over the past two weeks, this has in fact dawned on the world. And when the headline scanning algos running our own stock markets realize that the world's biggest marginal economy has absolutely no short-term liquidity left, the aftermath will be very ugly.
VIX broke above its 10-week moving average.
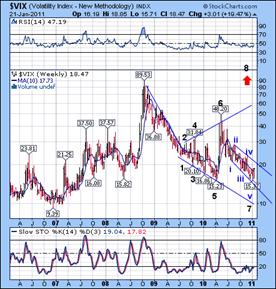 --The VIX broke out of its 10-week moving average and is on a buy signal. This, of course, becomes an early sell signal for equities. It has yet to break out of its declining Broadening Wedge, which would imply a resumption of the trend involving the Flash Crash.
ONE SELDOM-DISCUSSED REALITY of the modern options market is that the computers that control pricing models sometimes get out of tune with market reality. As stocks grind higher, as occurred in the fourth quarter, the models anticipate lower implied volatility because stock prices have advanced in the past. The past few days saw institutional investors buying bearish puts to protect against a decline, but the action wasn't significant enough to cause a rapid increase in implied volatility.
SPX closed above Cycle Top Resistance.
 SPX closed below weekly Cycle Top Resistance at 1293. It appears that the Master Cycle from July 1 may be rolling over into a potential low in March. Last week’s Pivot was the strongest candidate for a reversal. We are beginning to see reversals in the hourly and daily charts. A cross below the 10-week moving average will reveal a reversal in the weekly chart.
A new Master Cycle may have begun on November 29th that targets the month of June or July for its low. Confirmation of that new cycle may come as early as this week, with a decline below 1173.00, the November low. A Flash Crash may bring the SPX below the Summer low.
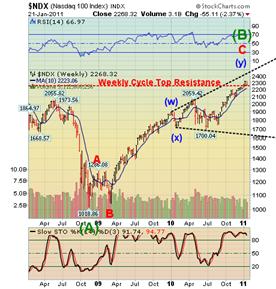
The NDX closed below Cycle Top Resistance.
 --The NDX closed below its weekly Cycle Top Resistance at 2277.00. The NDX now has a sell signal at both daily and weekly trends. The May Flash Crash started at this technical level.
NYSE margin debt balances have steadily risen over the past year. Furthermore, the December numbers to be released next week should show another large increase – in all likelihood showing an increase in margin debt close to the $300 billion area. In fact, the ratio of margin debt to free credit balances has remained over 1.6-to-1 for the past year and climbed to 1.9-to-1(or higher) in the last quarter. Source: NYSE
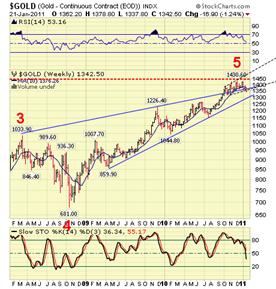
Gold violated its Broadening Wedge.
 -- Gold violated the lower trendline of its Broadening Wedge at 1365. That action sets up next week for a breakdown through the weekly Diagonal Formation. There is a combination Trading Cycle and Primary Cycle low due January 25. Combination cycle lows are usually stronger than average, so the decline may also be deeper than projected. The next probable target is mid-Cycle support at 1013.00.
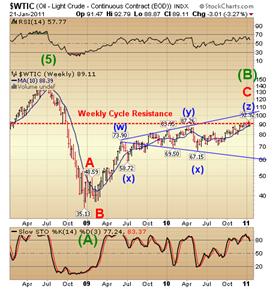
$WTIC ready to violate its 10-week moving average.
-- $WTIC still remains above its 10-week moving average at 88.39, but is already on a daily sell signal. The entire Commodities Index appears to be due for a Master Cycle low between January 25 and February 7. Both daily and weekly Cycle Models suggest a drop below the Broadening Formation trendline at 60.00 by then. Wonder why the smart money was rushing headlong out of gold and silver over the past few days, and especially today in the AM session? Here is your answer: in tried and true fashion the Comex just hiked margins in gold, and silver by about 6%, and threw in a few other commodities to mask things up. And unlike the last time it did it, when it could at least pretend to justify its actions with the surge in gold price, this time with the PM complex dropping, we wonder what excuse the CME will use this time.
The Bank Index repelled by its Cycle Top Resistance.
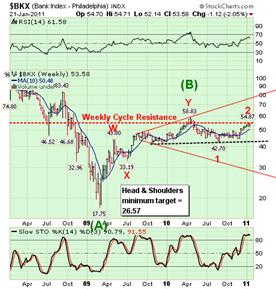 --The $BKX backed away from weekly Cycle Top Resistance at 55.82 and formed a probable right shoulder to a massive Head and Shoulders pattern. If the BKX made its last Master Cycle low on November 29th, then it may be ready for a sharp sell-off this week.
Three months ago, in light of the then released news that various parties among which the New York Fed and PIMCO are seeking to putback $47 billion worth of mortgages to Bank of America, we looked at the bank's reserve for reps and warranties and came to the conclusion that it was woefully under-reserved.
The Shanghai Index trades at mid-Cycle Support.
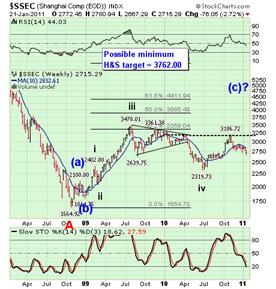 --The Shanghai Index made its weekly close at its mid-Cycle Support. This is a dicey move, since this level defines whether $WTIC remains in an uptrend or not. The inverted H&S neckline is still operative, but a rally above the 10-week moving average at 2832.61 is necessary to confirm that pattern. A further decline on Monday may indicate whether the 3186.72 high may be a truncated fifth wave.
Lately the biggest action in stocks is coming not out of the US, where the 4 month old melt up is on its last fumes, but out of China, where the marginal liquidity has now dried up, leading to such explosions of concern as 7 day SHIBOR going asymptotic
$USB may be building a base.
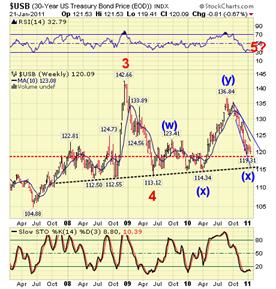 -- $USB appears to building its base just above its daily Cycle Bottom support at 118.88. It is still within its descending Broadening Wedge, which is a continuation formation. $USB appears to be gathering strength for the next rally higher. A weekly close above its 10-week moving average will confirm the reversal. It was just one month ago that the 2s30s hit a fresh high. In the meantime, things for Blackhawk Ben have not gone quite as QExpected: the 30 Year has just hit 4.6%, which with the 2 Year still remaining relatively flat, has led to some dramatic fireworks in the 2s30s curve which just hit a fresh 30 year high of just under 400 basis points. Ben is starting to lose control of tail end inflation expectations, and with that he will soon be forced to intervene much more forcefully in managing prices and yields.
$USD declines on shorts covering the Euro.
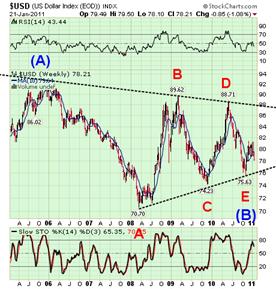 -- $USD lengthened its retracement to 57.5% this week. While the retracement in the $USD has been approaching the 61.8% retracement, the Euro retracement has just barely hit the 50% retracement level this week. The new low would qualify as a Primary Cycle low.
Today, the CFTC released its weekly update of non-commercial futures exposure. As expected, the covering rally was fierce and intense, and is likely still ongoing: net non-speculative long positions surged by 49,291, in line with the highest one week move in recent years, the biggest of which was recorded in June 2010 when net shorts collapsed by 49,585. The net result pushed net spec positions from -45,182 to 4,109, and resulted in a move in the EURUSD from 1.33 last Friday to 1.3621 at last check. We believe the short covering rally is now over.
Traders alert: The Practical Investor is currently offering the daily Inner Circle Newsletter to new subscribers. Contact us at tpi@thepracticalinvestor.com for a free sample newsletter and subscription information.
Our Investment Advisor Registration is on the Web
We are in the process of updating our website at www.thepracticalinvestor.com to have more information on our services. Log on and click on Advisor Registration to get more details.
If you are a client or wish to become one, please make an appointment to discuss our investment strategies by calling Connie or Tony at (517) 699-1554, ext 10 or 11. Or e-mail us at tpi@thepracticalinvestor.com .
Anthony M. Cherniawski, President and CIO http://www.thepracticalinvestor.com
As a State Registered Investment Advisor, The Practical Investor (TPI) manages private client investment portfolios using a proprietary investment strategy created by Chief Investment Officer Tony Cherniawski. Throughout 2000-01, when many investors felt the pain of double digit market losses, TPI successfully navigated the choppy investment waters, creating a profit for our private investment clients. With a focus on preserving assets and capitalizing on opportunities, TPI clients benefited greatly from the TPI strategies, allowing them to stay on track with their life goals
Disclaimer: The content in this article is written for educational and informational purposes only. There is no offer or recommendation to buy or sell any security and no information contained here should be interpreted or construed as investment advice. Do you own due diligence as the information in this article is the opinion of Anthony M. Cherniawski and subject to change without notice.
Anthony M. Cherniawski Archive |
© 2005-2022 http://www.MarketOracle.co.uk - The Market Oracle is a FREE Daily Financial Markets Analysis & Forecasting online publication.