


Basic Elliott Wave Theory Patterns: How a Zigzag Differs from a Flat
InvestorEducation / Elliott Wave Theory Jan 21, 2011 - 06:03 PM GMTBy: EWI

 The big picture for Elliott wave analysis is five-wave patterns followed by three-wave patterns. Let's look at the three-wave corrections more closely to get a bead on how they differ from one another. This excerpt from EWI's Basic Tutorial describes in detail what you need to know about so-called zigzag and flat corrections to be able to recognize them on a price chart.
* * * * *
Excerpted from Lesson 3 of EWI's Basic Tutorial
A single zigzag in a bull market is a simple three-wave declining pattern labeled A-B-C. The subwave sequence is 5-3-5, and the top of wave B is noticeably lower than the start of wave A, as illustrated in Figures 1-22 and 1-23.
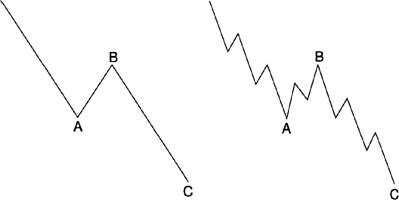
Figure 1-22 and Figure 1-23
In a bear market, a zigzag correction takes place in the opposite direction, as shown in Figures 1-24 and 1-25. For this reason, a zigzag in a bear market is often referred to as an inverted zigzag.
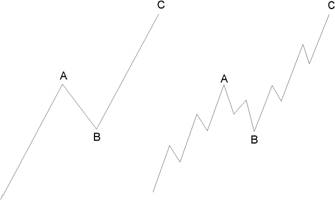
Figure 1-24 and Figure 1-25
Occasionally zigzags will occur twice, or at most, three times in succession, particularly when the first zigzag falls short of a normal target. In these cases, each zigzag is separated by an intervening "three," producing what is called a double zigzag (see Figure 1-26) or triple zigzag. These formations are analogous to the extension of an impulse wave but are less common.
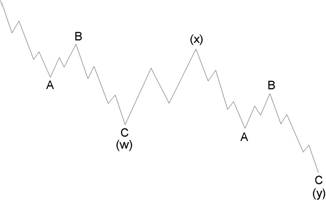
Figure 1-26
The correction in the Standard and Poor's 500 stock index from January 1977 to March 1978 (see Figure 1-27) can be labeled as a double zigzag.…Within impulses, second waves frequently sport zigzags, while fourth waves rarely do.
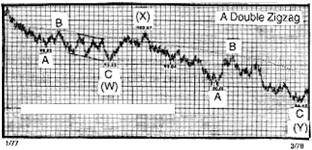
Figure 1-27
* * * * *
Excerpted from Lesson 4 of EWI's Basic Tutorial
A flat correction differs from a zigzag in that the subwave sequence is 3-3-5, as shown in Figures 1-29 and 1-30. Since the first actionary wave, wave A, lacks sufficient downward force to unfold into a full five waves as it does in a zigzag, the B wave reaction, not surprisingly, seems to inherit this lack of countertrend pressure and terminates near the start of wave A. Wave C, in turn, generally terminates just slightly beyond the end of wave A rather than significantly beyond as in zigzags.
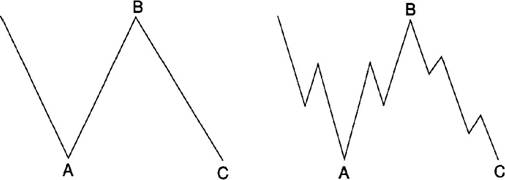
Figure 1-29 and Figure 1-30
In a bear market, the pattern is the same but inverted, as shown in Figures 1-31 and 1-32.
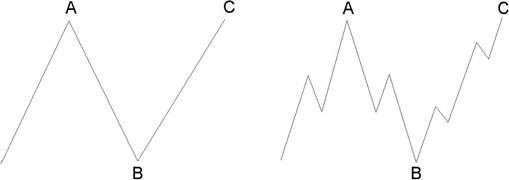
Figure 1-31 and Figure 1-32
Flat corrections usually retrace less of preceding impulse waves than do zigzags. They participate in periods involving a strong larger trend and thus virtually always precede or follow extensions. The more powerful the underlying trend, the briefer the flat tends to be. Within impulses, fourth waves frequently sport flats, while second waves do so less commonly.
What might be called "double flats" do occur. However, Elliott categorized such formations as "double threes," a term we discuss in Lesson 9.
The word "flat" is used as a catchall name for any A-B-C correction that subdivides into a 3-3-5. In Elliott literature, however, three types of 3-3-5 corrections have been identified by differences in their overall shape. In a regular flat correction, wave B terminates about at the level of the beginning of wave A, and wave C terminates a slight bit past the end of wave A, as we have shown in Figures 1-29 through 1-32. Far more common, however, is the variety called an expanded flat, which contains a price extreme beyond that of the preceding impulse wave. Elliott called this variation an "irregular" flat, although the word is inappropriate as they are actually far more common than "regular" flats.
Here's what you'll learn:
- What the basic Elliott wave progression looks like
- Difference between impulsive and corrective waves
- How to estimate the length of waves
- How Fibonacci numbers fit into wave analysis
- Practical application tips for the method
- More
This article was syndicated by Elliott Wave International and was originally published under the headline Basic Wave Patterns: How a Zigzag Differs from a Flat. EWI is the world's largest market forecasting firm. Its staff of full-time analysts led by Chartered Market Technician Robert Prechter provides 24-hour-a-day market analysis to institutional and private investors around the world.
© 2005-2022 http://www.MarketOracle.co.uk - The Market Oracle is a FREE Daily Financial Markets Analysis & Forecasting online publication.