


U.S. Interest Rates, Economy, and the 1YR T-Bill
Interest-Rates / US Interest Rates Jan 18, 2011 - 12:16 PM GMTBy: Tony_Caldaro

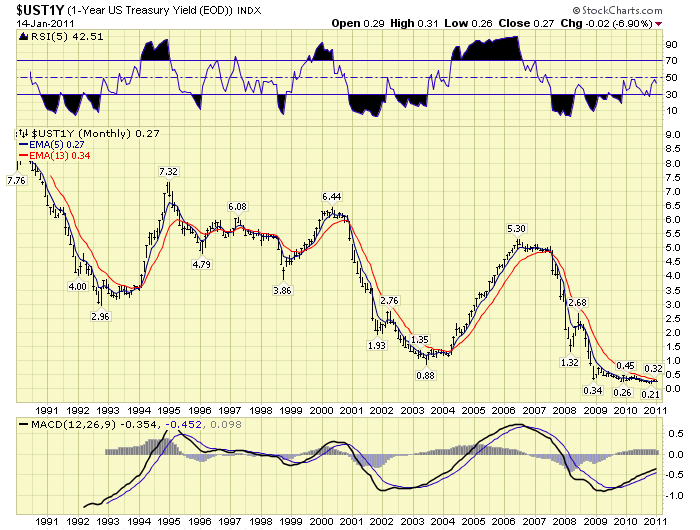
 When one monitors the various markets for a number of years they accumulate tidbits of technical/economic information mostly from others, and some on their own. It is this “some on their own” that can give an investor just enough of an edge to be ahead of the crowd. It is common knowledge that the FED raises and lowers short term interest rates to meet their full employment/low inflation mandate. We can generally observe the movement of their rate decisions by monitoring the 1YR t-bill rate, as illustrated by the 30 year chart below.
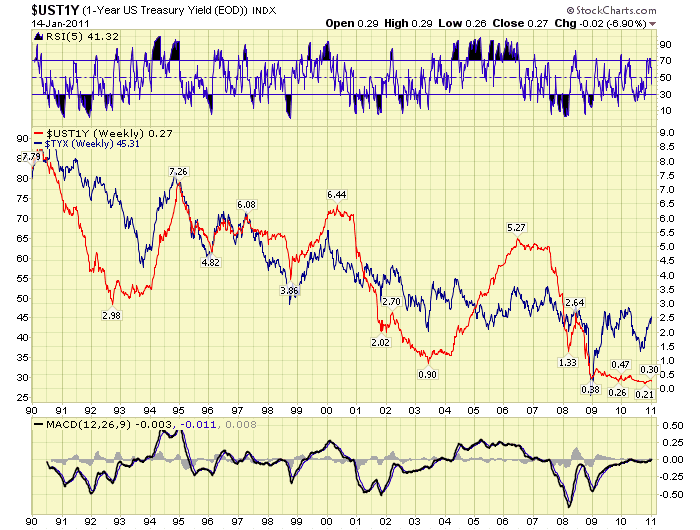
What is also common knowledge is the term “inverted yield curve”. This occurs when short term rates equal or exceed long term rates, i.e. the 1YR t-bill rate is higher than the 30YR bond rate. The chart below illustrates that the economy does not do well after an extended period with an inverted yield curve. The high short term rates eventually stymie economic growth and a recession usually follows. Again nothing new - common knowledge. What we examine next is not common knowledge.
It is well understood that the FED sets short term rates by monitoring several of their economic models. It is not so commonly understood that the 1YR t-bill rate actually “leads” in the interest rate decision process. When we review the 1YR rate versus the FED Funds rate during the last normal economic expansion one can observe this process in action.
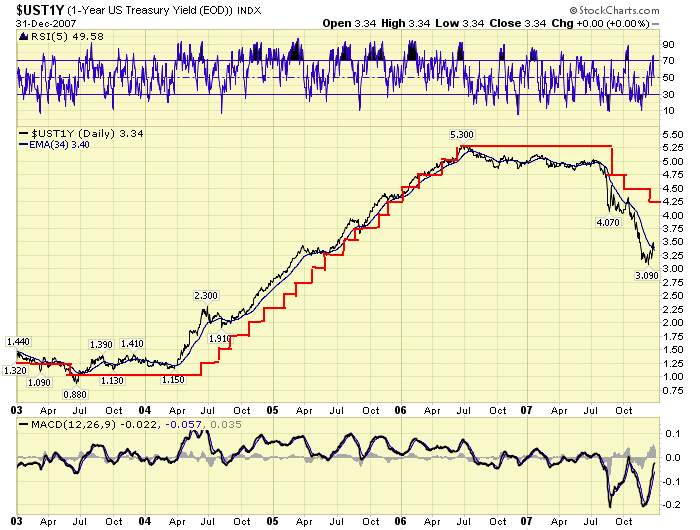
During the 2002-2007 bull market and economic expansion the 1YR rate (black) rose ahead of the FED funds rate (red) on a consistent basis. At the beginning of the expansion the 1YR rate stayed within 50 basis points of the FED funds rate until the spring of 2004. The FED, btw, established a floor on FED funds at 100 basis points (1.0%), and remained at this level for about one year. By mid-2004 the FED was falling behind the markets rise in short term rates. In other words the 1YR rate was substantially more than 50 basis points over FED funds. In June 2004 the FED initiated an incremental program of raising the FED funds rate 25 basis points after every FOMC meeting. Since they were now well behind the curve, and in an undershoot (to low) condition, it was the appropriate action at the time. By June 2005 the FED had effectively caught up when FED funds hit 3.25%.
After that they appeared to continue to keep pace with market forces until the end of 2005 when FED funds hit 4.25%. For some reason, however, they did not stop raising rates at that point. They continued to raise rates, incrementally, right into July 2006 when FED funds hit 5.25%. This effectively created an overshoot (too high) condition for the economy. At the time we suspected, and reported in this blog, that the FED was targeting the housing bubble. Which is not in their general mandate. Nevertheless, after the summer of 2006 the FED was clearly in an overshoot situation. The 1YR rate stayed between about 4.85% and 5.10% for about one year. An appropriate FED funds rate, at that time, would have been 4.75%, not 5.25%. The FED could have started lowering rates after the 1YR remained below their targeted rate for six months. Especially after an inverted yield curve condtion.
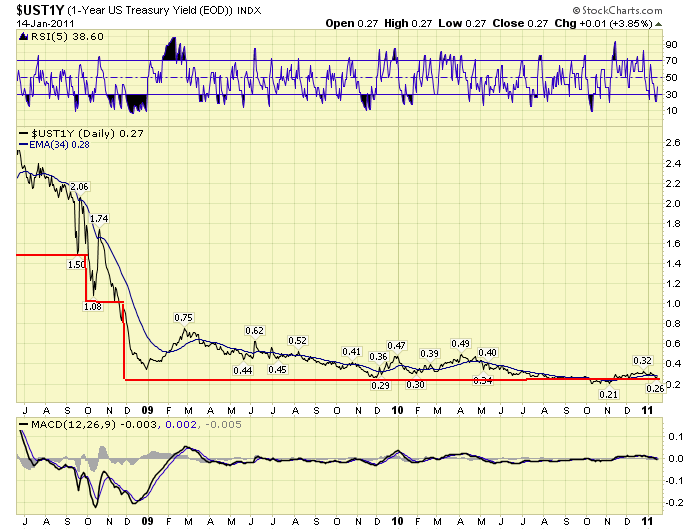
When the 2008/2009 economic crisis first began to rear its head, in the summer of 2007, 1 YR rates began to fall further. The economy was beginning to weaken after an extended period with an inverted yield curve. In August 2007 the 1YR rate had declined to 4.0% and the FED was still at 5.25%. It was not until September 2007 that the FED actually made its first rate cut, and only to 4.75%. The market was indicating something much more than that was required with the 1YR at 4.0%.
As the economic crisis unfolded the FED chased 1YR rates all the way down. By the spring of 2008 they finally caught up to market forces when the FED funds rate hit 2.0%. Eventually they went into the undershoot mode again when the economy froze solid in the fall of 2008. By December 2008 FED funds rates were at an historic low of 0.25% (25 basis points). Where they have remained for over two years. Observe the 1YR t-bill rate during this two period of time. Not once has it risen more than 50 basis points over the FED funds rate. Not once! In fact since late 2009 the 1YR has hovered within 25 basis points of the FED funds rate for the entire time. The FED remains effectively in line with current market conditions.
The purpose of this piece was/is not to criticize the FED. They do not need another critic. The purpose is to illustrate that market forces, specifically the 1YR rate, provide excellent guidance as to where short term rates should be at any given point in time. As long as the 1YR rate trades with a 50 basis points range of FED funds the FED does not have to move interest rates at all. And, there should be no anxiety that they will unexpectedly. With the FED funds rate currently at historic lows do not expect the FED to even begin thinking about raising rates until the 1YR starts trading over 75 basis points, above a 0.75% yield. When it does the FED will likely hesitate, like they did in 2004, and create another undershoot condition. Then they will be forced to play catch up again. You can monitor the 1YR along with us on page 13 of this link:
CHARTS: http://stockcharts.com/def/servlet/Favorites.CServlet?obj=ID1606987
http://caldaroew.spaces.live.com
After about 40 years of investing in the markets one learns that the markets are constantly changing, not only in price, but in what drives the markets. In the 1960s, the Nifty Fifty were the leaders of the stock market. In the 1970s, stock selection using Technical Analysis was important, as the market stayed with a trading range for the entire decade. In the 1980s, the market finally broke out of it doldrums, as the DOW broke through 1100 in 1982, and launched the greatest bull market on record.
Sharing is an important aspect of a life. Over 100 people have joined our group, from all walks of life, covering twenty three countries across the globe. It's been the most fun I have ever had in the market. Sharing uncommon knowledge, with investors. In hope of aiding them in finding their financial independence.
Copyright © 2011 Tony Caldaro - All Rights Reserved Disclaimer: The above is a matter of opinion provided for general information purposes only and is not intended as investment advice. Information and analysis above are derived from sources and utilising methods believed to be reliable, but we cannot accept responsibility for any losses you may incur as a result of this analysis. Individuals should consult with their personal financial advisors.
© 2005-2022 http://www.MarketOracle.co.uk - The Market Oracle is a FREE Daily Financial Markets Analysis & Forecasting online publication.