


U.S. Economic Growth Recession Continues, QE2's Problems
Economics / US Economy Jan 18, 2011 - 04:41 AM GMTBy: John_Mauldin

 Long-time readers of Outside the Box are familiar with the names Dr. Lacy Hunt and Van Hoisington. They are a regular feature here, as quite frankly, anything that Lacy writes or says I pay serious attention to. This is their regular quarterly report, where they outline seven things that are likely to retard US growth. An easy read, but take the time to think this through.
Hoisington Investment Management Company (www.hoisingtonmgt.com) is a registered investment advisor specializing in fixed-income portfolios for large institutional clients. Located in Austin, Texas, the firm has over $4 billion under management, composed of corporate and public funds, foundations, endowments, Taft-Hartley funds, and insurance companies.
And now let's jump right into the essay.
Your loving Wi-Fi on the plane analyst,
John Mauldin, Editor
Outside the Box
Hoisington Fourth-Quarter Report By Van Hoisington and Dr. Lacy Hunt
Growth Recession Continues
Factoring in a 4% Q4 growth rate, the U.S. economy expanded by 3% in real terms from the 4th quarter of 2009 through the 4th quarter of 2010. Despite this rise in GDP, the unemployment rate remained stubbornly high at 9.6% in the last quarter of 2010, only slightly lower than the 10% rate it averaged in the same quarter one year ago. Positive real GDP growth with high unemployment is the definition of a growth recession. An even slower growth rate of real GDP should be recorded over the next four quarters, suggesting the unemployment rate will be essentially unchanged a year from now. As we have noted previously, this modest expansion is due to the significant over-indebtedness of the U.S. economy. We see seven main impediments to economic progress in 2011 that will slow real GDP expansion to the 1.5%-2.5% range.
First, fiscal policy actions are neutral for 2011. Second, state and local sectors will continue to be a drag on the economy and labor markets in 2011. Third, Quantitative Easing round 2 (QE2) will likely produce only a slight economic benefit as the Fed continues to encourage additional leverage in an already over-indebted economy. Fourth, while consumers boosted economic growth in the second half of 2010 by sharply reducing their personal saving rate, such actions are not sustainable. Fifth, expanding inventory investment, the main driver of economic growth since the end of the recession in mid-2009, will be absent in 2011. Sixth, housing will continue to be a persistent drag on growth. Seventh, external economic conditions are likely to retard U.S. exports.
Fiscal Policy in Neutral
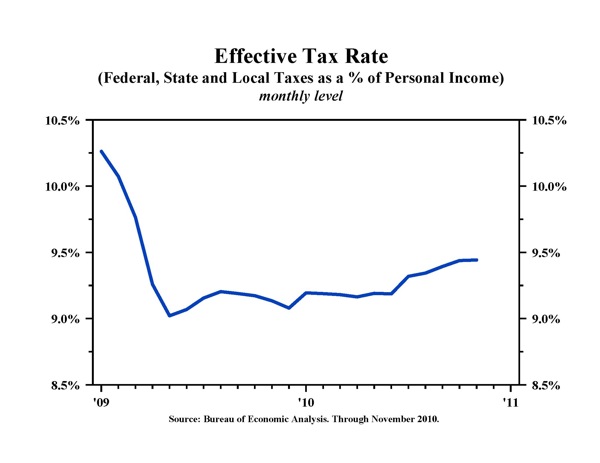
The recent tax compromise between the President and Congress merely extended existing tax rates for another two years and provided a transitory 2% reduction in social security tax withholding. Personal taxes, including federal and non-federal, rose to 9.44% of personal income in November, up from a low of 9.1% in the second quarter of 2009 (Chart 1). Even with the tax compromise this effective tax rate will continue moving higher as a result of higher state and local taxes. Economic research has documented that temporary changes in tax rates are far less beneficial than permanent ones since consumers spend on the basis of permanent income. Higher outlays for unemployment insurance were also legislated, but these were negated by cuts in other types of spending. Federal spending through early March will mirror its pace in fiscal 2010, and the rest of the 2011 budget will decline slightly in real terms. Therefore, total real federal expenditures are likely to contract in real terms this year.
Chart 1
If fiscal policy becomes focused on long-run considerations (e.g. deficit reduction) economic conditions will improve over time. But, if fiscal policy remains focused on short-term stimulus, the economy's prolonged under-performance will persist since the government expenditure multiplier is less than one, and possibly close to zero.
The recent scientific work on the expenditure multiplier is aligned with the Ricardian equivalence theorem as well as the views of the Austrian economists who continued to follow Ricardo even when the Keynesian revolution was ascendant. Economist Gary Shilling made this point very well in his outstanding new book, The Age of Deleveraging - Investment Strategies for a Decade of Slow Growth and Deflation.
Dr. Shilling's analysis of the simplified and unsubstantiated Keynesian multiplier (p.216) still taught in many colleges and universities is extremely insightful. "But the Austrian School of economists like Friedrich Hayek and Ludwig von Mises believed that the economy is much more complicated... The Austrian view suggests that the government spending multiplier may be only 1.0 and that there are not any follow-on effects. More recent academic studies indicate that the multiplier is less than 1.0, and perhaps much less."
After recognizing the difficulty of calculating the multiplier, Dr. Shilling writes, "Also, the inherent inefficiencies of government reduce the effects of deficit spending and lower the multiplier." Thus, if steps are taken to reduce deficit spending, the economy's growth rate will recover after the initial transitory negative impact as additional resources are provided to the private sector.
State and Local Governments Drag
Municipal governments face substantial cyclical deficits and significant underfunding of their employee pension plans. In addition, municipal bond yields rose sharply in the second half of 2010, increasing borrowing costs, probably an unintended consequence of QE2. The municipal bond market proceeds are used primarily for funding capital projects, which suggests that such projects will be delayed. State and local governments typically do not undertake capital projects freely when they have large cyclical deficits.
To reign in these financial imbalances, state and local governments have five choices: (1) cut personnel; (2) reduce expenditures including retirement benefits; (3) raise taxes; (4) borrow to fund operating deficits; or (5) declare bankruptcy. All retard economic growth. Any trend toward increased bankruptcy would raise caution in the broader municipal market and add to higher borrowing costs. Raising taxes may give bondholders more confidence, but such actions can fail to raise new revenue as slower economic conditions retard spending. The demographic trends in the decennial census also show that people are increasingly moving to low tax regions, contributing to worsening fiscal imbalances from the exited areas.
QE2's Problems
Clearly, Fed actions have affected stock and commodity prices. The benefits from higher stock prices accrue very slowly, are small, and are slanted to a limited number of households. Conversely, higher commodity prices serve to raise the cost of many basic necessities that play a major role in the budget of virtually all low and moderate income households.
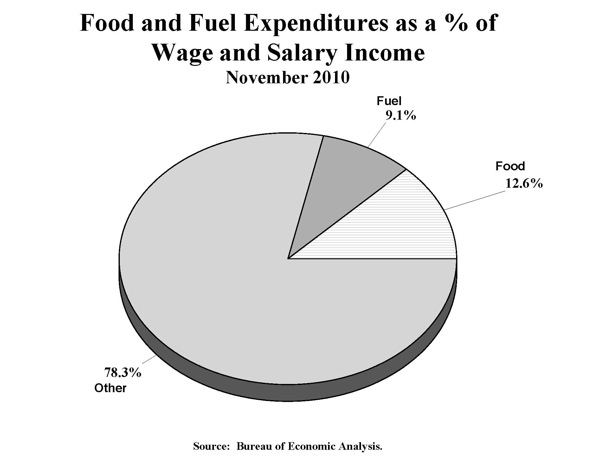
For example, in late 2010 consumer fuel expenditures amounted to 9.1% of wage and salary income (Chart 2). In the past year, the S&P GSCI Energy Index advanced by 14.6%. Since energy demand is highly price inelastic, it seems there is little alternative to purchasing these energy items. Thus, with median family income at approximately $50,000, annual fuel expenditures rose by about $660 for the typical family. In late 2010, consumer food expenditures were 12.6% of wage and salary income. In the past year, the S&P GSCI Agricultural and Livestock Commodity Price Index rose by 40%. If we conservatively assume that just one quarter of these raw material costs are ultimately passed through to consumers, higher priced foods will have added another roughly $626 per year of essential costs to the median household budget. These increased costs could be considered inflationary, however, with wage income stagnant, higher food and fuel prices will act like a tax increase. Indeed, the approximately $1300 increase in food and fuel prices is equal to 2.6% of median family income, an amount that more than offsets the 2% reduction in the social security tax for 2011.
Chart 2
Reflecting the inflationary psychology of the higher stock and commodity prices, mortgage rates and municipal bond yields have risen significantly since QE2 was first proposed by the Fed chairman, increasing the cost and decreasing the availability of credit for two sectors with serious underlying problems. Also, Fed policy has pushed most consumer time, money market, and saving deposit rates to 1% or less, thereby reducing the principal source of investment income for most households. Clearly the early read on QE2 is negative for the economy.
Substitution Effects
In a November speech in Frankfurt, Germany, Dr. Bernanke said that the use of the term "quantitative easing" to refer to the Federal Reserve's policies is inappropriate. He stated that quantitative easing typically refers to policies that seek to have effects by changing the quantity of bank reserves. These are channels that the Chairman considers relatively weak, at least in the U.S. context. Dr. Bernanke goes on to argue that securities purchases work by affecting yields on the acquired securities in investors' portfolios, via substitution effects in investors' portfolios on a wider range of assets. This may well be true, but the substitution effects are just as likely to be detrimental (i.e. the adverse implications of increasing commodity prices and rising borrowing costs for some and reducing interest income for others). Importantly, the Fed has no control over these substitution effects.
In his reputation-establishing 2000 book, Essays on the Great Depression, Dr. Bernanke argues that "some borrowers (especially households, farmers and small firms) found credit to be expensive and difficult to obtain. The effects of this credit squeeze on aggregate demand helped convert the severe, but not unprecedented downturn of 1929-30 into a protracted depression." Interestingly, when QE2 drives up borrowing costs for homeowners and municipalities, thereby restricting credit, the Fed is creating (according to Dr. Bernanke's book) the exact same circumstance, albeit on a reduced scale, that helped cause the great depression---rather bizarre!
Liquidity Mistakes
For the past twelve years the Fed's policy response to economic problems has been to pump more liquidity. These problems included: (1) the failure of Long Term Capital Management in 1998; (2) the high tech bust in 2000; (3) the mild recession that began with a decline in real GDP in the fall of 2000; (4) 9/11; (5) the mild deflation of 2002-3; (6) the market crisis and massive recession and housing implosion of 2007-9; and now, (7) the lack of a private-sector, self-sustaining recovery.
The Fed diagnosed each of these events as being caused by insufficient liquidity. Actually, the lack of liquidity was symptomatic of much deeper problems caused by their own previous actions. The liquidity injected during these events led to a series of asset bubbles as the economy utilized the Fed's largesse to increase aggregate indebtedness to record levels. The liquidity problems arose as the asset bubbles burst when debt extensions could not be repaid and generally became unmanageable. Each succeeding calamity or bust reflected reverberations from prior Fed actions.
While governmental directives to Fannie and Freddie to increase home ownership clearly also played a role, the Fed supported this process by providing excessive liquidity to fund the housing bubble as well as other unprecedented forms of leveraging of the U.S. economy. The heavy leveraging and the associated asset bubbles, however, produced only transitory and below trend economic growth. Similarly, like its predecessors, QE2 is designed to cure an over-indebtedness problem by creating more debt.
In addition to failing to revive the economy permanently, major unintended consequences have arisen. The LTCM bankruptcy created a $3 billion loss, a very modest amount in view of the sums required by subsequent bailouts. The Fed's reaction to LTCM served to give market participants a signal that the Fed would back-stop those regardless of whether they engaged in or enabled bad behavior. Also, Fed actions have conditioned Wall Street to seek Fed support whenever stock prices come under downward pressure. In fact, the process of leaking out QE2 began in the midst of a stock market sell off.
Well-intentioned actions to promote growth and fine tune the economy by micromanagement have instead produced failure. Although the Fed had little choice in massively supporting financial markets in 2007/8, no Fed intervention would have been a more long-term productive stance in the previous economic events. QE2 is another example of flawed Fed policy operations.
The Saving Rate Decline
In the second half of 2010, real GDP grew at an estimated 3.3% annual rate (assuming the fourth quarter growth rate was 4%), up from 2.7% in the first half of the year. Transitory developments in two of the most erratic and unpredictable components of the economy---the personal saving rate and inventory investment---accounted for all of this acceleration.
From 6.3% in June 2010, the personal saving fell by a significant 1%, to 5.3% in November (Table 1). Consumer spending is slightly in excess of 70% of real GDP. Without the one percentage point reduction in the personal saving rate, the second half growth rate would have been 2.6%, a shade slower than the first half growth pace, and materially less than the presumed second half growth rate.
Table 1
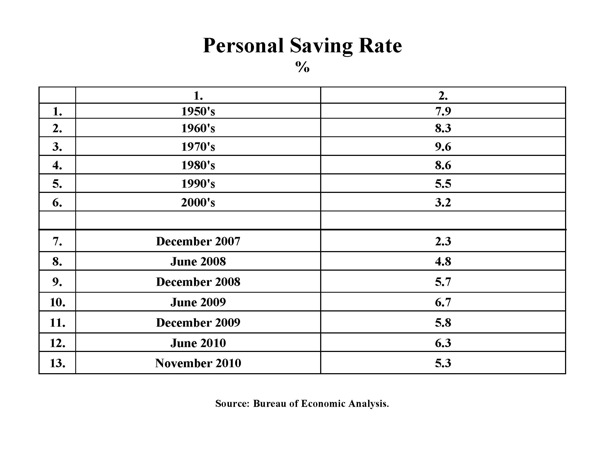
When job insecurity is high, and defaults, delinquencies and bankruptcies are at or near record levels, a drawdown in the saving rate would seem to be an unlikely event. This development is certainly viewed favorably by retailers but the issue is whether the economy's future is better served by using the funds to make mortgages current, pay other debts and prepare consumers for potential emergency needs. Thus, the lowering of the saving rate is similar to running monetary and fiscal policy to meet short-run needs while ignoring long-term consequences.
Inventory Reversal
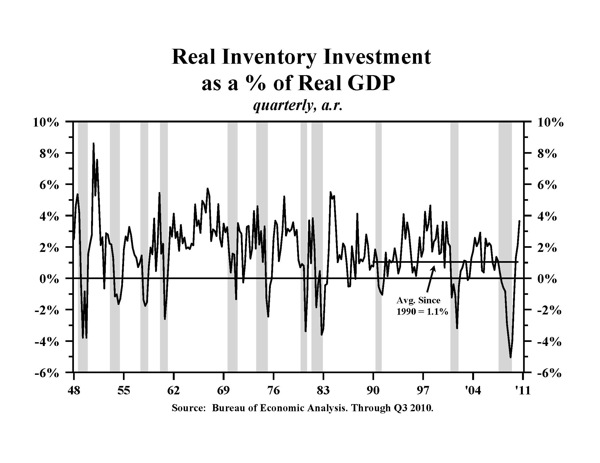
Inventory investment was the main driver of economic growth since the recession ended in mid-2009. Based on published data, real GDP grew at a 2.9% annual rate over this span. However, real final sales, which excludes inventory investment from GDP, increased at a paltry 1.1% pace. In the third quarter, inventory investment surged to 3.7% of GDP while preliminary fourth quarter figures on retail, wholesale and manufacturing inventories indicate this figure might have reached 4% (Chart 3). In the final quarter of the recession, inventory investment was -5.1% of GDP. Since 1990, the period of modern inventory control mechanisms, inventory investment averaged only 1.1%. At a minimum, the dominant source of aggregate economic strength will not repeat in 2011.
Chart 3
Housing Drag Persists
Housing will remain a drag on economic activity in 2011. Prices have re-accelerated to the downside over the past four months, as mortgage yields have risen and the housing overhang has increased. The housing overhang, as explained by Laurie Goodman writing in the Amherst Mortgage Insight, "is not caused solely by the number of non-performing loans that exist in the market. The problem also includes the high rates at which re-performing loans are re-defaulting, along with the relatively high rates at which deeply underwater loans that have never been delinquent are running two payments behind for the first time."
Another major problem is that home prices are still too high. An excellent and well-researched study by Danielle DiMartino Booth and David Luttrell in the December 2010 Economic Letter from the Dallas Fed documents this issue very authoritatively. Booth and Luttrell write, "As gauged by an aggregate of housing indexes dating to 1890, real home prices rose 85% to their highest level in August 2006. They have since declined 33 percent... In fact, home prices still must fall 23% if they are to revert to their long-term mean."
From the standpoint of most households, the home is the main component of wealth, not stock market investments. The continuing drop in housing prices serves to underscore the ill advised and likely temporary drop in the personal saving rate that was so critical to economic performance late last year.
Adverse Global Considerations
The global economy since 2009 may be referred to as a two-speed recovery, with China, India, Brazil, and other emerging economies at the high speed and the U.S. and Europe at the slow speed. That pattern is likely to continue, but with an important difference. China, India, and Brazil are likely to slow adversely affecting the U.S. and Europe. Thus, the two-speed recovery will continue, but with the entire world growing at a much more modest pace. Two major considerations point to this outcome. First, the higher food and fuel prices discussed earlier will serve to significantly depress growth in countries like China, India and Brazil where food and fuel are known to be a much higher percentage of household budgets. Already reports have surfaced from international agencies on the growing adverse consequences of higher food prices, and social unrest has also been witnessed on a limited basis.
Second, Chinese economic policy is designed to slow growth and reduce inflationary pressures. Although the People's Bank of China (PBoC) has already taken several actions to contain surging inflation, more steps may be needed. In China, as elsewhere, inflation is a lagging indicator. It is worth considering that the PBoC has never been able to engineer a soft landing, which suggests that ultimately a downturn in China may be greater than the prevailing consensus.
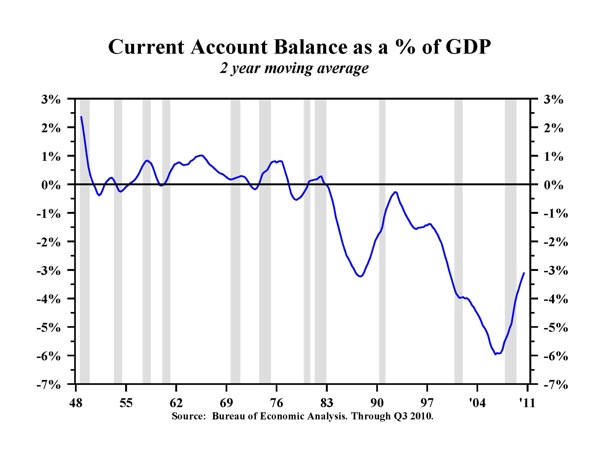
Thus, changing global conditions should serve to moderate U.S. exports. Ironically, the U.S. current account deficit still may continue to improve. A stabilization of the saving rate will reduce U.S. imports, while a higher saving rate will cut imports significantly. Already this two-speed global economy has resulted in a reduction in the U.S. current account deficit of approximately 3% of GDP (Chart 4). A continuation of this trend will serve to underpin the value of the dollar, which rose in 2010. The firm dollar, in turn, will serve to keep U.S. disinflationary trends intact.
Chart 4
Bond Market Conditions
In spite of the adverse psychological reaction to the QE2, long Treasury bond yields dropped to 4.3% at the end of 2010, down 30 basis points from the close of 2009, producing a total return of slightly more than 10% for a portfolio of long Treasury and zero coupon bonds. The problematic economic environment and its depressive effect on inflation suggests long Treasury bond yields could easily decrease another 30 basis points in 2011, which would produce another double-digit rate of return for a similar portfolio. The probabilities of even lower yields are significant.
John F. Mauldin
johnmauldin@investorsinsight.com
John Mauldin, Best-Selling author and recognized financial expert, is also editor of the free Thoughts From the Frontline that goes to over 1 million readers each week. For more information on John or his FREE weekly economic letter go to: http://www.frontlinethoughts.com/learnmore
To subscribe to John Mauldin's E-Letter please click here:http://www.frontlinethoughts.com/subscribe.asp
Copyright 2010 John Mauldin. All Rights Reserved
Note: John Mauldin is the President of Millennium Wave Advisors, LLC (MWA), which is an investment advisory firm registered with multiple states. John Mauldin is a registered representative of Millennium Wave Securities, LLC, (MWS), an FINRA registered broker-dealer. MWS is also a Commodity Pool Operator (CPO) and a Commodity Trading Advisor (CTA) registered with the CFTC, as well as an Introducing Broker (IB). Millennium Wave Investments is a dba of MWA LLC and MWS LLC. Millennium Wave Investments cooperates in the consulting on and marketing of private investment offerings with other independent firms such as Altegris Investments; Absolute Return Partners, LLP; Plexus Asset Management; Fynn Capital; and Nicola Wealth Management. Funds recommended by Mauldin may pay a portion of their fees to these independent firms, who will share 1/3 of those fees with MWS and thus with Mauldin. Any views expressed herein are provided for information purposes only and should not be construed in any way as an offer, an endorsement, or inducement to invest with any CTA, fund, or program mentioned here or elsewhere. Before seeking any advisor's services or making an investment in a fund, investors must read and examine thoroughly the respective disclosure document or offering memorandum. Since these firms and Mauldin receive fees from the funds they recommend/market, they only recommend/market products with which they have been able to negotiate fee arrangements.
Opinions expressed in these reports may change without prior notice. John Mauldin and/or the staffs at Millennium Wave Advisors, LLC and InvestorsInsight Publishing, Inc. ("InvestorsInsight") may or may not have investments in any funds cited above.
Disclaimer PAST RESULTS ARE NOT INDICATIVE OF FUTURE RESULTS. THERE IS RISK OF LOSS AS WELL AS THE OPPORTUNITY FOR GAIN WHEN INVESTING IN MANAGED FUNDS. WHEN CONSIDERING ALTERNATIVE INVESTMENTS, INCLUDING HEDGE FUNDS, YOU SHOULD CONSIDER VARIOUS RISKS INCLUDING THE FACT THAT SOME PRODUCTS: OFTEN ENGAGE IN LEVERAGING AND OTHER SPECULATIVE INVESTMENT PRACTICES THAT MAY INCREASE THE RISK OF INVESTMENT LOSS, CAN BE ILLIQUID, ARE NOT REQUIRED TO PROVIDE PERIODIC PRICING OR VALUATION INFORMATION TO INVESTORS, MAY INVOLVE COMPLEX TAX STRUCTURES AND DELAYS IN DISTRIBUTING IMPORTANT TAX INFORMATION, ARE NOT SUBJECT TO THE SAME REGULATORY REQUIREMENTS AS MUTUAL FUNDS, OFTEN CHARGE HIGH FEES, AND IN MANY CASES THE UNDERLYING INVESTMENTS ARE NOT TRANSPARENT AND ARE KNOWN ONLY TO THE INVESTMENT MANAGER.
John Mauldin Archive |
© 2005-2022 http://www.MarketOracle.co.uk - The Market Oracle is a FREE Daily Financial Markets Analysis & Forecasting online publication.