Gold Bull Market … Far From Over
Commodities / Gold and Silver 2011 Jan 16, 2011 - 12:14 PM GMTBy: Tony_Caldaro
 The bull market in Gold is entering its tenth consecutive year of a long term uptrend. In the entire history of the US stock market, 1885 – 2011, there has only been one long term uptrend that was longer. The thirteen year, 1987 – 2000, long term uptrend that led to the dotcom bubble in the late 1990′s. For many, this type of bull market in Gold will be a once in a lifetime event.
The bull market started during the dotcom bust, and the secular low in commodities, in 2001 when it was only $255/oz. Since this is more of a monetary event, (as are all bull markets in Gold), than a price appreciation event, this bull market has been unfolding in five Primary waves. One must keep in mind that Gold is not becoming more valuable. Its purchasing power remains relatively constant over time. This bull market is unfolding, in price, because the currencies that are required to purchase one ounce of Gold are becoming relatively less valuable. This is exactly what occurred during the 1933-1946 and 1967-1980 Gold bull markets as well.
In 1933 FDR lowered the value of the USD, relative to Gold, by raising its price from $20.67/oz. to $35.00/oz in USD. In 1970 Nixon lowered the value of the USD, relative to Gold, by removing the USD off the Gold standard completely when it was $42.00/oz. For the past several years the FED has been lowering the value of the USD, relative to Gold, with massive liquidity injections under the tranquil term of Quantitative Easing. Basically, the purchasing power of the USD is being devalued again, and, it requires more and more of these devalued USD’s to purchase one ounce of Gold. This is not a local event. Currencies worldwide are also being devalued, and, the cost of one ounce of Gold is rising worldwide no matter the currency.
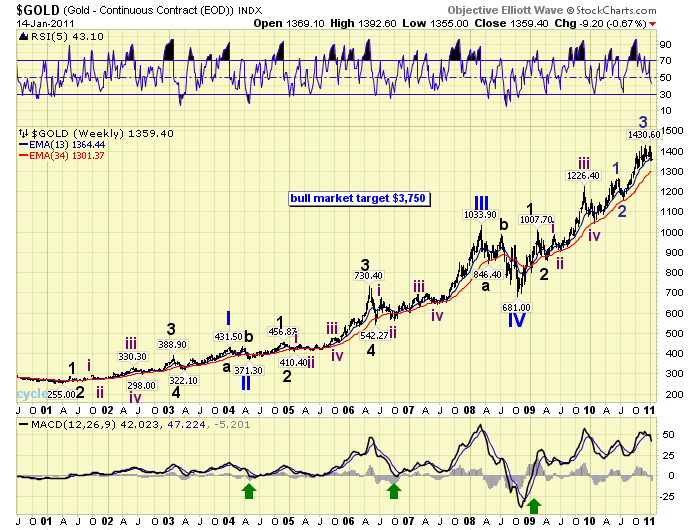
Since Gold is always aligned with the commodity 13 year secular bull market, we are expecting Gold to top around the year 2014: 2001 – 2014. As noted above the bull market is unfolding in five Primary waves. Primary I took three years, 2001 – 2004, as the price of Gold rose modestly from $255 to $432. Primary wave II bottomed in 2004 at $371. Primary wave III lasted four years, 2004-2008, as Gold rose a much more impressive $371 to $1034. Notice the relationship of the rise in Primary wave III ($663) to the rise in Primary wave I ($167). Then during the economic meltdown of 2008 Gold declined in Primary wave IV to $681. At that low Gold entered its final primary wave of the bull market, the historically parabolic Primary wave V.

As you can observe from the weekly chart this bull market is expanding in complexity. The 1987-2000 13 year bull market in equities was even more complex. Primary wave I is quite simple, with an extended Major wave 3. Primary wave III was a bit more complex, with both Major waves 3 and 5 extending. Primary wave V is already more complex. Not only is Major wave 3 extending, but Intermediate wave five of Major 3 is also extending. This is exactly how markets prepare to go parabolic. The waves continue to subdivide, with minor corrections along the way, forcing buyers in at higher and higher prices. Naturally, there will be a sizeable correction at some point, when buying subsides, during Major wave 4. Then Gold will enter the parabolic Major wave 5. This will likely coincide with a worldwide economic event. The most likely culprit will be the continuously rising inflationary pressures in the fast growing emerging economies.
The 1967-1980 Gold bull market unfolded in time cycles with the following pattern in years: 3-3-3-2-2. This translates into important turning points in the following years: 1970-1973-1976-1978-1980. The current bull market appears to be following a slightly different time cycle pattern: 3-2-2-3-3, or 2004-2006-2008-2011-2014. As a result we expect Major wave 3 to top in 2011, and Major wave 4 to bottom in 2011 as well.

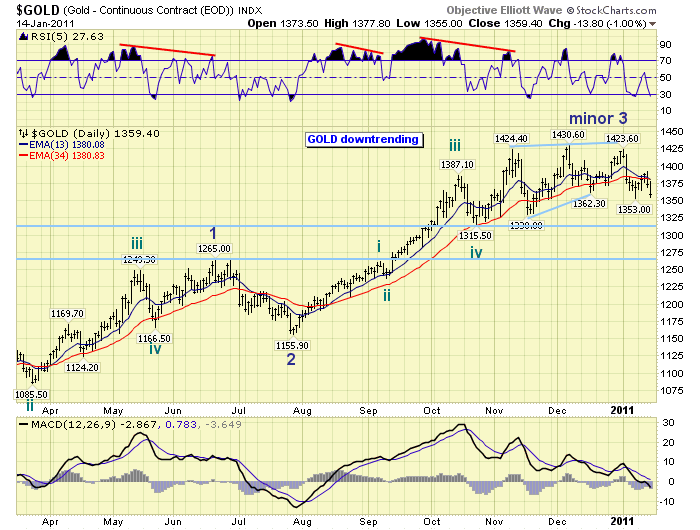
Currently Gold is in a Minor wave 4 downtrend. We’re expecting this downtrend to end in February around the $1315 area or a bit lower. Upon completion Minor wave 5, of Intermediate wave five, of Major wave 3 will be underway. This next uptrend could be quite dynamic. Historically, and even in this bull market, the fifth waves have been the strongest of the five wave sequence of a similar degree.
In review of the entire bull market, thus far, these fifth waves have had a 2.62 to 4.24 multiple fibonacci relationship to their third waves. This suggests two potential upside targets for the end of Major wave 3 in 2011: $1700+ and $2200+. We’ll take the conservative target of $1700+ for now. You can track Gold along with us using page 10 on this link:
CHARTS: http://stockcharts.com/def/servlet/Favorites.CServlet?obj=ID1606987
http://caldaroew.spaces.live.com
After about 40 years of investing in the markets one learns that the markets are constantly changing, not only in price, but in what drives the markets. In the 1960s, the Nifty Fifty were the leaders of the stock market. In the 1970s, stock selection using Technical Analysis was important, as the market stayed with a trading range for the entire decade. In the 1980s, the market finally broke out of it doldrums, as the DOW broke through 1100 in 1982, and launched the greatest bull market on record.
Sharing is an important aspect of a life. Over 100 people have joined our group, from all walks of life, covering twenty three countries across the globe. It's been the most fun I have ever had in the market. Sharing uncommon knowledge, with investors. In hope of aiding them in finding their financial independence.
Copyright © 2011 Tony Caldaro - All Rights Reserved Disclaimer: The above is a matter of opinion provided for general information purposes only and is not intended as investment advice. Information and analysis above are derived from sources and utilising methods believed to be reliable, but we cannot accept responsibility for any losses you may incur as a result of this analysis. Individuals should consult with their personal financial advisors.
© 2005-2022 http://www.MarketOracle.co.uk - The Market Oracle is a FREE Daily Financial Markets Analysis & Forecasting online publication.


