


Gold Hits Lowest Close in Two Months
Commodities / Gold and Silver 2011 Jan 16, 2011 - 12:07 AM GMTBy: Merv_Burak

Gold has hit its lowest closing level (but not yet its intra-day level) in almost two months. The intermediate term momentum indicator is at its lowest level since early August. The price action seems to be developing a weaker and weaker strength, not usually a good sign.
GOLD : LONG TERM
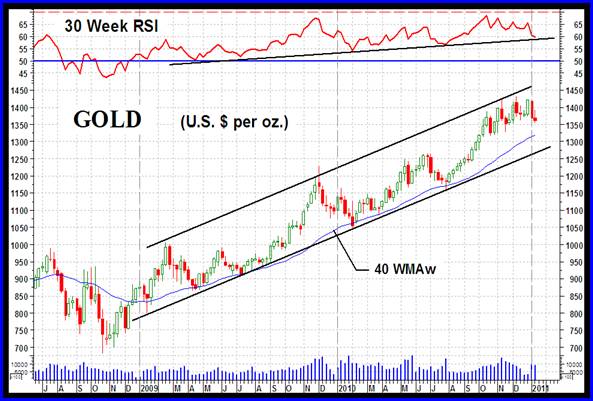
I mentioned the intermediate term momentum weakness in the introduction. Even the long term momentum is showing greater weakness than the price action. The indicator is well below recent levels while the price is still holding its own, but weakening. The long term weekly price/momentum chart shows the two year old up trending channel in the price action and the support line in the momentum. The momentum support appears ready to be breached but the price action is still some distance from its channel support line. The weakening momentum may be more of a sign of intermediate term reversal than a long term reversal. There is still a long way to go for the momentum to get into its negative zone (below 50%). The one thing that this action DOES suggest is that one should hold off on new purchases until things get a little stronger or if one just must buy then one should understand that one is doing so at a time of much greater risk of reversals. Since the indicators are not yet bearish one would not be on the sell or short sell side as far as long term commitments are concerned. Most likely what lies ahead may be a very good new buying opportunity but not yet. The daily and weekly action should tell us when it’s ready to start new purchases again.
The long term P&F chart looks like it’s in a topping process but is still some distance to a reversal signal. That would come on a move to the $1320 level if we get no further up and down activity (although $1305 might be a better reversal point).
As for the normal long term indicators, gold remains comfortably above its positive sloping moving average line. The momentum indicator is still well inside its positive zone although it is heading lower and is below its negative sloping trigger line. As for the volume indicator, it is starting to show weakness with the price action and has been flirting with its trigger line. On Friday it remained above its trigger line but only slightly so. The trigger is still in a positive slope for now. All in all the long term rating remains BULLISH.
INTERMEDIATE TERM
Things do not look good from the intermediate term perspective. Gold has now moved below its moving average line and the line slope has just turned slightly downward. The momentum indicator is moving lower fast but is still slightly above its neutral line in the positive zone. Another negative day might put it below the line. The momentum indicator is below its negative sloping trigger line. The volume indicator is now below its trigger line and the trigger has turned to the down side. Everything seems to be a bummer from the intermediate term so the rating has now gone full BEARISH. However, the short term moving average line is sitting right on top of the intermediate term line (both have the same moving average value) and one cannot yet claim it to be confirming the bear, that should come on the next trading day.
SHORT TERM
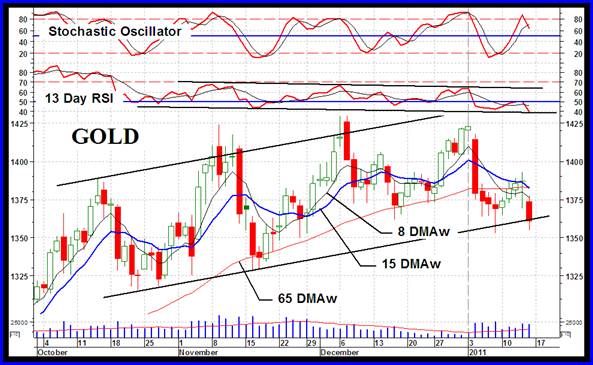
I showed this channel last week. The gold action may be said to have just penetrated the lower support line but I’ll give it another day to see if there is any follow-through. Depending upon the thickness of the line used one could say that gold had not quite penetrated the line yet. In any respect it does look like the direction of motion should take gold decisively below the line very, very soon. How significant would such a break be? Well, it would be a support break but we already have a moving average break and negative ratings for the shorter time periods so this would be just one more indication that things are not all that rosy.
Gold dropped below its short term moving average line (15 DMAw) about two weeks ago and remains below the line. The line itself is tracing a negative path. The momentum indicator is in its negative zone below a negative trigger line. As for the daily volume action, that has been above its 15 day average volume for the past two weeks now, during the down price days. Not a good sign. For now all the indicators are saying BEARISH on the short term. The very short term moving average line is confirming this bear by remaining below the short term moving average line.
As for the immediate direction of least resistance, that would have to be to the down side but who knows what global fiasco lies ahead to affect gold.
SILVER
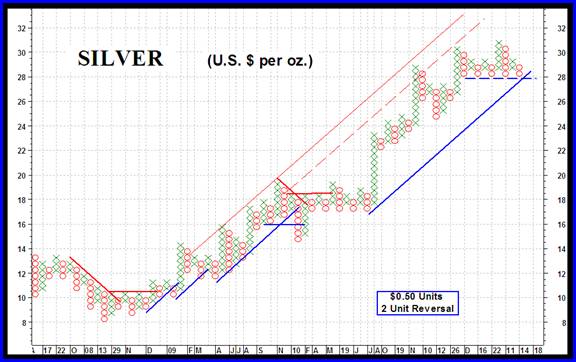
Although silver still has a better [performance than has gold, for all three investment time periods, silver has been acting weaker lately. Once more it declines more than gold did this past week although the difference was minor. The initial projection for such break would be to the $21 level which is on top of the previous significant consolidation period and does sound like a good place to halt. But that is getting ahead of the game, first the break.
The P&F chart shown this week suggests that silver is in a very precarious position. A move to the $28.00 level will cause it to break below a very solid support but it would need another $0.50 to break below the up trend line so $27.50 is the number to watch. On a daily bar chart silver has already broken below an up trend line so maybe that is a warning of things to come.
The short and long term indicators are basically similar to the gold indicators giving us a BULLISH rating for the long term and a BEARISH rating for the short term. On the intermediate term there is a difference. Although silver has just very slightly closed below its intermediate term moving average line the line slope is still to the up side. The momentum indicator is moving lower fast (similar to gold) but it is still in its positive zone. It is, however, below its negative trigger line. As for the volume indicator, it is now two weeks into being below its trigger line and the trigger is pointing downward. On the intermediate term the rating is not quite fully bearish yet but is at the – NEUTRAL level. The short term moving average line is still somewhat above the intermediate term line and not yet at a position to confirm any bearish rating so we have to wait at least a few days to see if the intermediate term reverses.
I know that often my ratings in these commentaries could be slightly different from those in the Table. I use slightly different indicators than those that are pre-programmed to develop the Table ratings. However, the two should not be in opposition for more than a weeks or two before they both are the same.
PRECIOUS METAL STOCKS.
That Merv’s Penny Arcade Index just keeps plugging away. While all else is disaster around it this Index has gained another 3.2%. One of the strongest indicators that even should the universe of gold and silver stocks go into a bear market it would not be expected to last for too long before turning back to the up side towards new highs. It is unheard of for the whole sector to go into a major bear market while the pennies continue in their “sky is the limit” track
Well, that’s it for this week. Comments are always welcome and should be addressed to mervburak@gmail.com.
By Merv Burak, CMT
Hudson Aero/Systems Inc.
Technical Information Group
for Merv's Precious Metals Central
For DAILY Uranium stock commentary and WEEKLY Uranium market update check out my new Technically Uranium with Merv blog at http://techuranium.blogspot.com .
During the day Merv practices his engineering profession as a Consulting Aerospace Engineer. Once the sun goes down and night descends upon the earth Merv dons his other hat as a Chartered Market Technician ( CMT ) and tries to decipher what's going on in the securities markets. As an underground surveyor in the gold mines of Canada 's Northwest Territories in his youth, Merv has a soft spot for the gold industry and has developed several Gold Indices reflecting different aspects of the industry. As a basically lazy individual Merv's driving focus is to KEEP IT SIMPLE .
To find out more about Merv's various Gold Indices and component stocks, please visit http://preciousmetalscentral.com . There you will find samples of the Indices and their component stocks plus other publications of interest to gold investors.
Before you invest, Always check your market timing with a Qualified Professional Market Technician
Merv Burak Archive |
© 2005-2022 http://www.MarketOracle.co.uk - The Market Oracle is a FREE Daily Financial Markets Analysis & Forecasting online publication.