To Beat the Stock Market, Be in the Right Sector - Part 3
InvestorEducation / Learning to Invest Oct 24, 2007 - 09:34 PM GMTBy: Hans_Wagner

 What stock market sector have you been in lately? The sectors that are beating the market or the ones that are trailing behind? Being in the right sectors will make a significant difference in the performance of your portfolio. However, finding the right sector can be a difficult proposition. In Part 1 I introduced the basic theory behind sector rotation as described by Stan Stovell in Standard & Poor's Guide to Sector Investing 1995 (this is an expensive book).
In Part 2 we examined a couple of recent studies on sector rotation that help illuminate the opportunities and the problems for investors. In this article I provide some guidelines for investors and traders on how to use sector rotation to achieve better investing results.
Quick Review of Sector Rotation
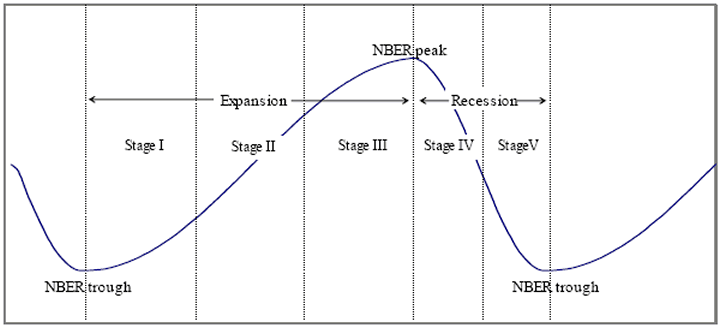
Jeffrey Stangl, Ben Jacobson and Nuttawat Visaltanachoti tested the sector rotation theory described by Stan Stovell's book Standard & Poor's Guide to Sector Investing 1995 . The following figure is taken from their paper published in July 2007 titled "Sector Rotation over Business-Cycles" , It is an idealized NBER-style business cycle divided into five stages as done in other studies. Economic expansions span trough to peak in Stages I-III; recessions, peak to trough in Stages IV-V. As indicated, expansions are typically last longer than recessions.

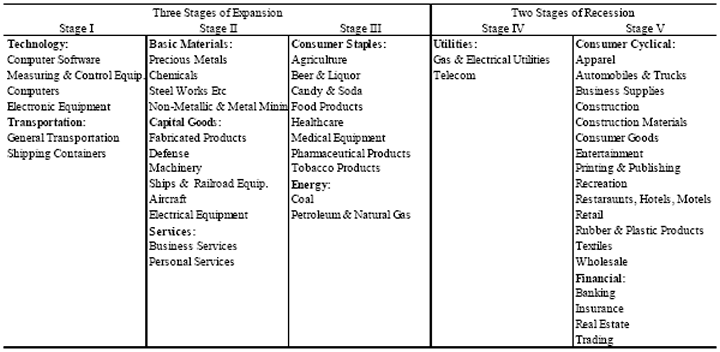
The following table is based on Standard & Poor's Guide to Sector Investing 1995. describes what sectors should perform best in each stage of the business cycle.

The concept is to use the economic cycle to determine what sectors to make investments. The study basically found that it is unlikely that an investor can outperform the broad stock market using the sector rotation theory described by M. Stovell. What is interesting is that the study underperformed the market in Stages I and II, the first two expansion stages. I will come back to this point later in this article.
In the other study written by Robert Johnson, C. Mitchell Conover, Gerald R. Jensen, and Jeffrey M. Mercer, published in the Journal of Investing indicates that a sector rotation strategy based on the Federal Reserve rate changes could substantially improve a portfolios performance over the past 33 years. According to the study investors do better when they follow a more aggressive strategy when the discount rate is decreasing and a more defensive strategy when the Fed is raising rates.
Looking at Sector Performance
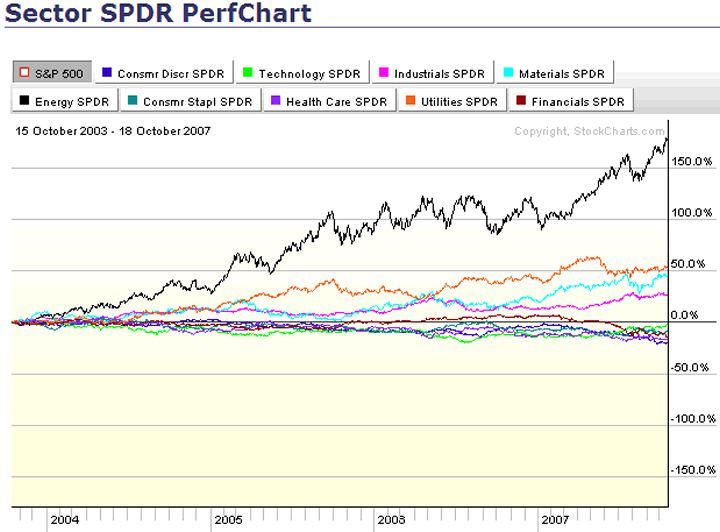
By many measures we are in the fifth year of a bull market. As a result we should see some sign of rotations of sectors as we have moved through the years. The chart below covers the four years from October 15, 2003 to October 18, 2007 (that is as far back as the PerfChart from StockCharts.com goes). In those four years Energy has been the dominate sector beating the S&P 500 by 150%. In the sector rotation study mentioned above, investors should only invest in energy during the third and final stage of the economic expansion. While I have not performed a detailed analysis of each stage of the economy, it seems obvious that energy performed well throughout the recent economic expansion.
Surprisingly Utilities was the second best sector followed closely by Materials and Industrials. According to the sector rotation chart above, investors should only consider investing in utilities when the economic cycle is in Stage IV, the first stage of a recession.
Five sectors, Consumer Discretionary, Consumer Staples, Technology, Healthcare and Financials actually performed worse than the S&P 500 over the four year period.

The table below shows the performance of the key S&P sectors by Economic Expansion Stage over the same four year period compared to the performance of the S&P 500. Let's make a couple of observations. First, Technology performed worse than the S&P 500 for the first three years. This is primarily due to the long term fall out from the technology bubble that ended in 2000. Second, only Consumer Staples, Healthcare and Utilities performed better than the prior year from October 2004 to October 2005. These would be considered conservative sectors suitable for a economic recession. Energy performed well for three of the four years, driven by the growing demand for oil and then the ever present supply concerns in regions where much of the world's oil is obtained.
Sector Performance by Year Middle of October 2003 to Middle of October 2007
| Stage | Sector | Oct 2003 - Oct 2004 | Oct 2004 - Oct 2005 | Oct 2005 - Oct 2006 | Oct 2006 - Oct 2007 |
| I | Technology | -6.65% | -2.75% | -0.40% | 9.12% |
| II | Industrials | 9.17% | -0.53% | 4.01% | 5.78% |
| II | Materials | 11.40% | -6.63% | 11.51% | 5.30% |
| III | Consumer Staples | -4.97% | 0.60% | -0.20% | -1.30% |
| III | Energy | 35.77% | 33.03% | -3.29% | 30.31% |
| III | Health Care | -6.52% | 5.06% | -5.49% | -5.45% |
| IV | Utilities | 10.75% | 17.30% | 1.82% | 5.30% |
| V | Consumer Discretionary | -0.40% | -6.98% | 3.25% | -10.86% |
| V | Financials | 0.14% | -2.51% | 9.62% | -15.27% |
My basic conclusions from this very brief analysis are:
-
Investors need to understand the fundamentals of the overall economy and the sectors before making a commitment.
-
Investors can make substantially more than the market if they pick the right sectors.
-
Picking the right sectors requires careful analysis developing investing themes based on what is driving the sector, especially over the next twelve months.
Selecting the Right Sectors, Know the Investing Theme
The investing theme should be clear and simple since there only a couple of key factors that determine the trend for the sector. Most of the time it involves what is driving the supply and demand for the products or services within the sector. For example in the energy sector the demand for oil throughout the world is growing as emerging economies grow rapidly and create new demands for energy.
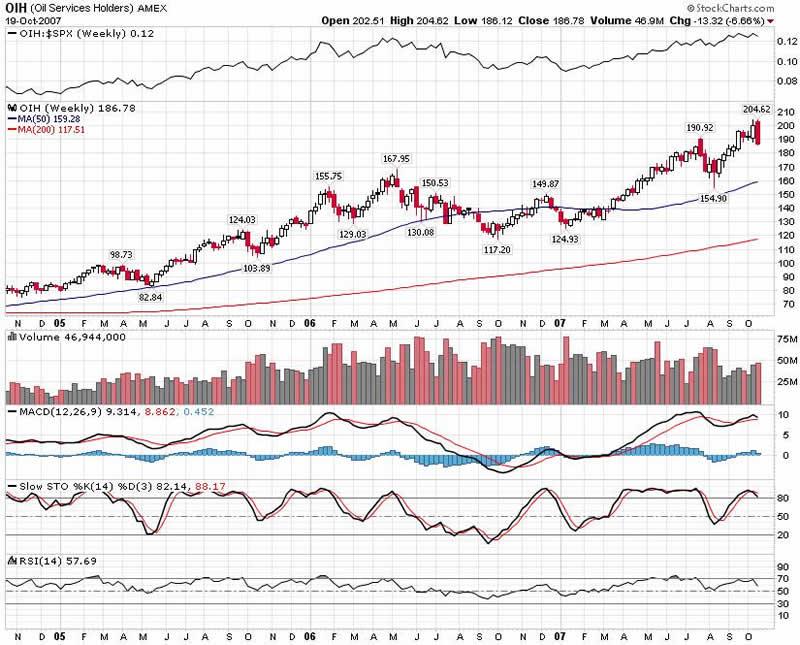
he available supply will become more expensive to find and new alternatives will be needed to keep up with the demand. From this overall theme, you can then focus on each sub-sector to assess where the best opportunities will lie. Continuing the example, the need for new supply will drive up the demand for those companies that can contribute to the exploration and development process for oil. This means the oil services companies should benefit. The chart below is of the Oil services Holders (OIH). Three years ago it was trading in the 90 to 100 range. Three years later it reached 200. A very nice return if one had identified and followed the theme.

When you are creating your theme, or borrowing from one's you have heard and like, be sure to look up and down the “supply chain” of the sector. You might be surprised by what you find, even in a different sector. For example drilling deeper for oil requires newer and better pumps and valves. Flowserve (FLS) designs and produces pumps and valves for the energy industry as well as others. It is classified in the Industrial sector, yet it benefits from the search for oil.
When developing the theme for the sector, be sure you look at the risks that are inherent with the theme. These risks might the trigger you need to know when to sell, reduce your position, or switch to another sector or sub-sector. For example, if the price of oil gets to high it is in danger of causing the economies of the world to slow down, possibly causing a recession. Periodicals like Barron's . usually present interesting factors to consider when evaluating sector themes.
Periodically review your sector themes to see if they still hold and what will cause them to no longer be valid. Themes can last for many years. They also can change gradually or quickly depending on the key drivers. Place a time limit on your investment when you are using themes to guide your stock selection. As you near the time limit, review the theme to verify its continued validity. If it changes, then change your portfolio as well. Use these times to look for new sectors that logically follow your changing themes.
The Bottom Line
Being in the fight sector can significantly contribute to your investing success. Investing themes are a great way to help identify what sectors for you to invest or to avoid. Themes can also be helpful when you are considering moving to another sector or sectors. Themes help to answer the question why is this sector the best place to invest. Develop themes around the basic economic situation for the sector such as supply and demand. They will serve you well as you grow your portfolio and beat the market.
By Hans Wagner
tradingonlinemarkets.com
My Name is Hans Wagner and as a long time investor, I was fortunate to retire at 55. I believe you can employ simple investment principles to find and evaluate companies before committing one's hard earned money. Recently, after my children and their friends graduated from college, I found my self helping them to learn about the stock market and investing in stocks. As a result I created a website that provides a growing set of information on many investing topics along with sample portfolios that consistently beat the market at http://www.tradingonlinemarkets.com/
Hans Wagner Archive |
© 2005-2022 http://www.MarketOracle.co.uk - The Market Oracle is a FREE Daily Financial Markets Analysis & Forecasting online publication.


