


Retail Sales Suggest Strong Q4 Consumer Spending
Economics / Economic Recovery Jan 15, 2011 - 05:43 AM GMTBy: Asha_Bangalore

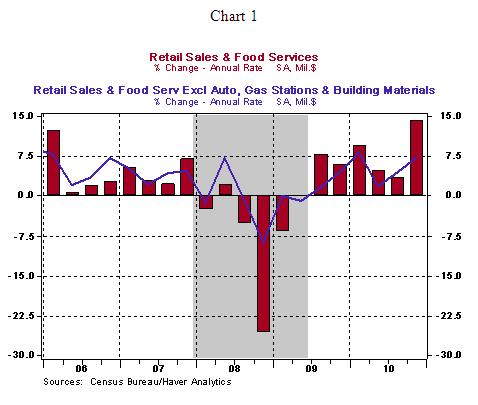
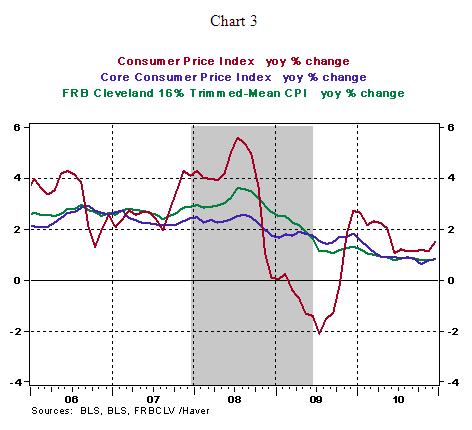
 Retail sales increased 0.6% in December after a 0.8% gain in the prior month. Building materials (+2.0%), autos (+1.0%), gasoline (+1.6%), and furniture (+1.0%) accounted for the relatively large gains among the components, while purchases of food (-0.6%), electronics (-0.6%) and clothing (-0.2%) dropped. Unit auto sales count in the computation of consumer spending in the GDP report, which advanced to annual rate of 12.5 million units in December. Autos sales rose 29% in the final three months of the year compared with a 0.3% gain in the third quarter.
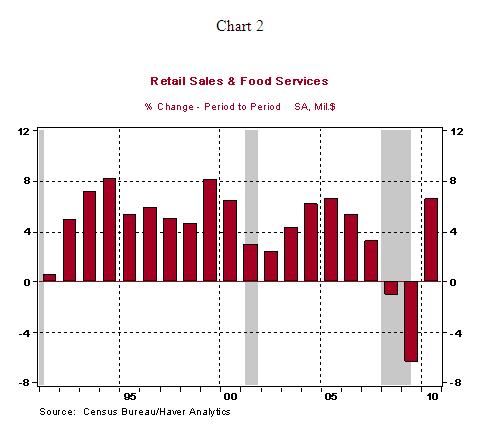
The increase in gasoline sales is mostly price-related. Excluding autos and gasoline, retail sales advanced 0.4% in December after a 0.6% increase in November. In the fourth quarter, total retail sales rose at an annual rate of 14.0% vs. a tepid 3.3% increase in the third quarter. Excluding autos, gasoline, and building materials, retail sales moved up at an annual rate of 7.3% in the fourth quarter after a 4.2% gain in the third quarter. Based on the latest retail sales numbers, it is nearly certain that consumer spending in the fourth quarter should exceed by far the 2.4% increase recorded in the third quarter. In 2010, retail sale advanced 6.6%, gains of this size were last recorded in 2005 and 1999 (see Chart 2).
Consumer Price Index - Energy Prices Lift Overall Price Index
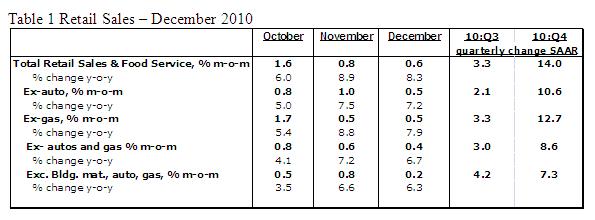
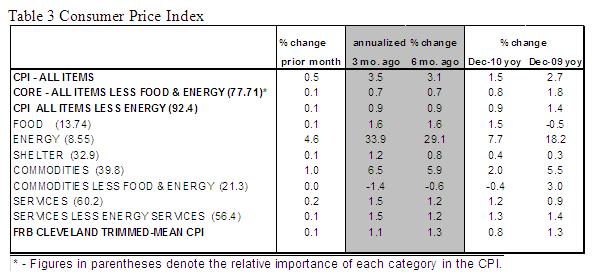
The Consumer Price Index (CPI) rose 0.5% in December, marking the largest monthly increase since June 2009. The Labor Department indicated that the 8.5% jump in gasoline price made up 80% of the increase in the overall CPI. In 2010, the CPI has risen 1.5% vs. a 2.7% increase in 2009. The energy price index moved up 7.7% in 2011 compared with an 18.2% jump in 2009. The decelerating trend of gasoline prices (13.8% vs. 53.5% in 2009) is the main reason for a moderation of the energy price index in 2010. Food prices rose 0.1% in December, putting the year-to-year increase at 1.5% vs. a 0.4% drop in 2009.
The core CPI, which excludes food and energy, edged up 0.1% in December after a similar gain in November. The core CPI shows a marked deceleration in the twelve months ended December 2010 (+0.8%) after a 1.8% increase in the same period of 2009. This is the smallest December-December increase since record keeping commenced for this index in 1957. As the table below indicates, with the exception of airfares and food, almost all other major components of the CPI showed a decline or a decelerating trend in 2010 compared with 2009. Shelter and medical care price increased nearly matched the gains seen in 2009.
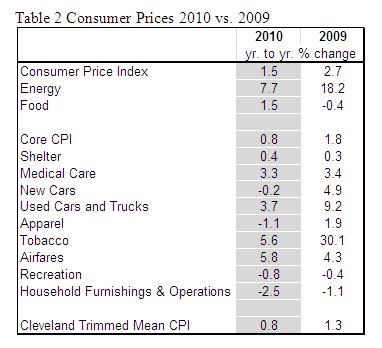
In December, prices indexes of shelter (+0.1%), airfares (+3.3%), medical care (+0.2%), apparel (+0.1%), and tobacco (+0.8%) advanced to more than offset declines in indexes measuring recreation, household furnishings, and used car prices.
Conclusion - The threat of deflation has subsided but the FOMC is watching closely price trends in the near term, given the decelerating trend of core prices and the subdued overall inflation reading. It is worth noting that higher energy prices have given a temporary lift to the overall CPI in December. The year-to-year change in the CPI has held at or below 1.5% for each of the past six months. The nature of the December inflation data and other recent economic reports reinforce the view that the Fed's $600 billion plan to purchase $600 billion will be completed on schedule.
Factory Production Shows Decelerating Trend
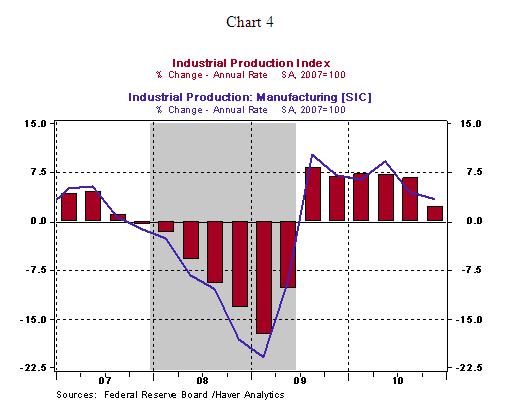
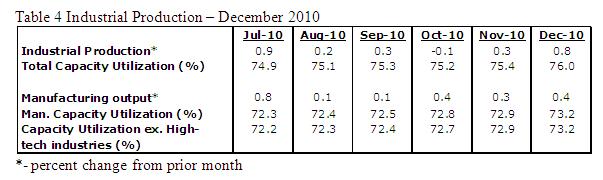
Industrial production rose 0.8% in December, reflecting a 4.3% gain in production at the nation's utilities and 0.4% increase in production at the nation's factories. Factory production has advanced at an annual rate of 3.4% in the fourth quarter of 2010 vs. a 4.5% increase in the third quarter. Factory activity was humming along at a faster pace in the first year of economic recovery (see Chart 4).
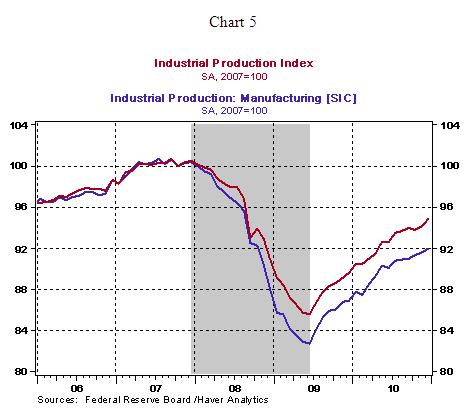
After six consecutive quarters of economic recovery, the level of factory activity is still eight percentage points below the peak registered in the final months of 2007 (see Chart 5).
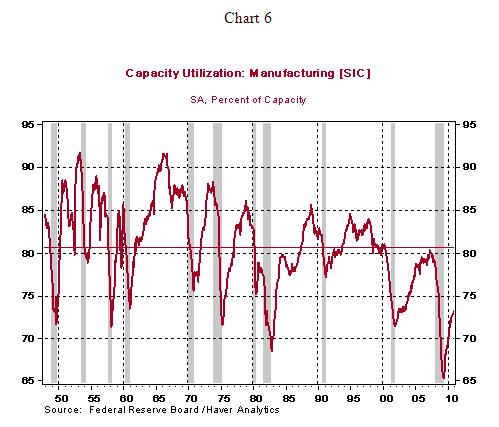
The operating rate of the factories rose to 73.2% in December from 72.9% in the prior month. The historical average for the factory operating rate is 80.7% (see Chart 6). In sum, there is enormous unused capacity in the factory sector which can support a robust increase in demand without exerting inflationary pressures.
Asha Bangalore — Senior Vice President and Economist
http://www.northerntrust.com
Asha Bangalore is Vice President and Economist at The Northern Trust Company, Chicago. Prior to joining the bank in 1994, she was Consultant to savings and loan institutions and commercial banks at Financial & Economic Strategies Corporation, Chicago.
Copyright © 2011 Asha Bangalore
The opinions expressed herein are those of the author and do not necessarily represent the views of The Northern Trust Company. The Northern Trust Company does not warrant the accuracy or completeness of information contained herein, such information is subject to change and is not intended to influence your investment decisions.
© 2005-2022 http://www.MarketOracle.co.uk - The Market Oracle is a FREE Daily Financial Markets Analysis & Forecasting online publication.