How to Find Bottoms for the SP500, Dow, Nasdaq and Russell 2K
Stock-Markets / Stock Markets 2011 Jan 10, 2011 - 02:43 AM GMTBy: Chris_Vermeulen

 It was a great first week in the market for 2011. Volume picked up as traders slowly return from holidays focusing on the markets again. Looking forward volume should continue to expand because there will be more traders in front of their terminals excited to see what type of money they can make in 2011.
Let’s jump into what happened last week. On Friday the market generated a short term trading signals to go long SP500, Dow, Nasdaq or Russell 2k. This trade seemed to fall on a perfect day because if we look back over last year’s weird trading characteristics typically if you were to buy on a Friday and hold a position until Monday it would have netted you a profit. Well on Friday the market had a very nice intraday pullback to a level which there was strong support so we bought in with a small position.
Let’s jump into the charts for a visual of what I am talking about…
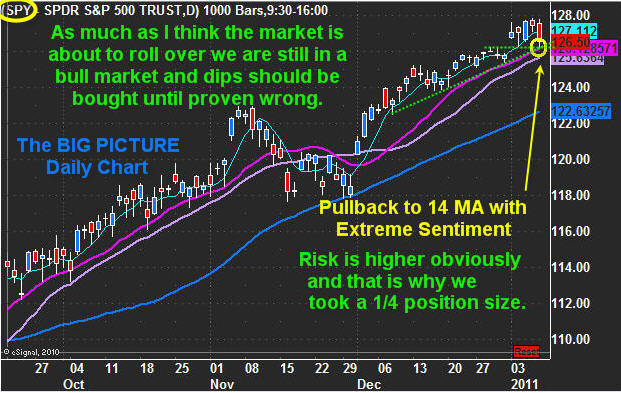
SPY – Daily Chart & Moving Averages
This chart shows the big picture. Currently we are in a strong uptrend and looking to buy significant pullbacks to key levels of support, and that is exactly what we had last week.
The market pulled back to a level which has support:
- It pulled back to the 14 day moving average
- It pulled back to the previous weeks high
- It pulled back to a support trend line
Each of these levels happen are at the same level and each type of support will attract a different type of trader, meaning there should be a lot of individuals covering their shorts and or buying at that point.

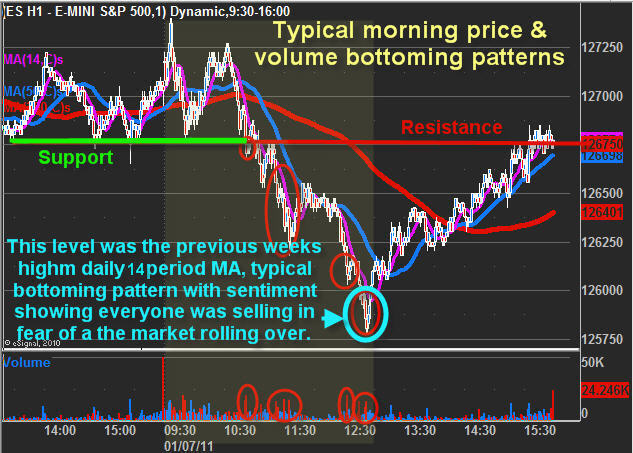
Friday’s 1 Minute Madness Chart
This is a 1 minute chart of just last Friday scrunched together so I can fit everything into the chart. What I want to show here is how the short term time frame can help you spot a bottom as it is forming. This actually is a little more complicated that im showing here but I hope you get the point.
Every day there is either a short term top or bottom which forms usually between 10am – 2pm ET. When the daily chart is in an uptrend you should focus on only trying play bottoms as the bias is up and even if your timing is off a little the overall larger trend typically will save your butt.
The chart below shows how a morning support level was broken and the market started to fall. That is the first time in the day which stops get triggered and the start of a new trend was born. The jump in volume was from traders who were long and used the morning support as a level to exit the position if it was broken in order to cut their losses. Bearish traders on the other hand would have been shorting on the breakdown anticipating lower prices.
Usually after a break there is a test of the breakdown level and we got that a few minutes later as which point more traders took short positions hoping for a continues selling. That wave of selling led to a sharp drop and then the first real bounce.
My general rule is you can trade the first pullback after a breakout or price surge. Now this can be taken two ways. You can trade the first test of a breakout which in my opinion carries the lowest risk and then you can still trade the first real bounce which comes after strong and steep price movement.
When looking for the bottom I like to see multiple new lows with price spikes as it means stops are being triggered, and more traders keep shorting the new lows. Once the herd is heavily weighted on the short side and the chart forms an ABC retrace then I know a bottom is near and all those shorts will be covering sooner than later

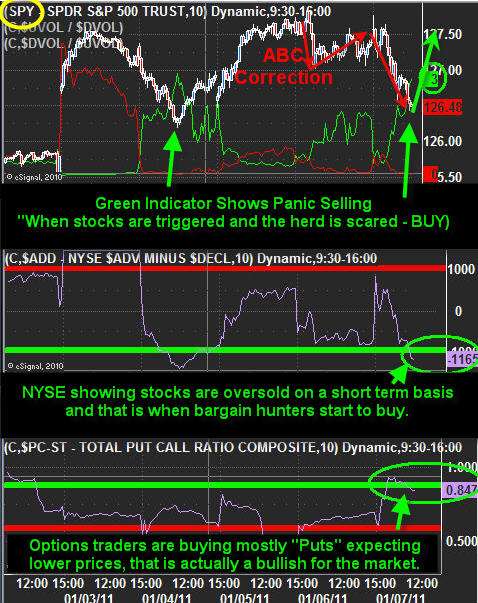
Market Sentiment Trading Indicators – 10 Minute Charts
Top Chart: SPY etf shows a possible ABC correction on the 10 minute chart along with panic selling as there we 3 sell orders to every 1 buy order. Everyone was running for the door.
Middle Chart: NYSE Advance Decline line was showing stocks were oversold on the short term basis and it’s just a matter of time before the price stabilizes or bounces.
Bottom Chart: Put/call ratio was telling me even the options traders were buying leverage to the down side. All of this tells me the majority of traders are selling and I like to do the opposite which you will learn over time.

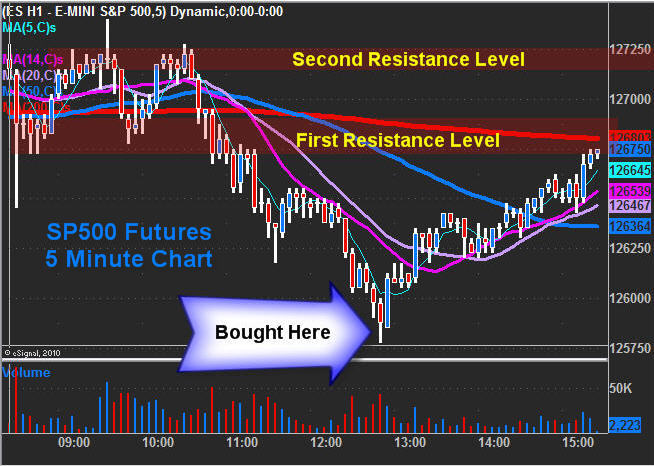
SP500 Futures – 5 Minute Chart of Friday
This shows where our entry point was using all the above indicators and trading analysis. Because the broad market has been rising for so long and showing signs of correcting any day now, a trader must be very picky/timely with their entry point and the amount of money put to work in these trades. But just because the market feels like it’s ready to roll over it does not mean we should be looking to go short. I strongly believe we buy the dips but keep our position sizes much smaller than normal. For all we know this uptrend could go on into May…
During an overbought/overextended market condition which I think most of us agree we are in, I am not willing to risk much capital in new positions and also the reason why I am really zooming in on the charts to get us the best possible price to reduce risk.

Weekend Broad Market Trading Conclusion:
Last week’s entry point required us to be very timely, but keep in mind this is not the norm. During a new trend we sometimes have 2-3 days to enter a position before the market starts to really move and it is those larger swing trades which make some decent money and last weeks at a time.
Anyways, thought I would share this info with a little more detail. As you can see there is a lot of information and timing that must come together for a trade setup and entry point.
If you would like to get more of my daily analysis to join my newsletter at www.GoldAndOilGuy.com
By Chris Vermeulen
Chris@TheGoldAndOilGuy.com
Please visit my website for more information. http://www.TheGoldAndOilGuy.com
Chris Vermeulen is Founder of the popular trading site TheGoldAndOilGuy.com. There he shares his highly successful, low-risk trading method. For 6 years Chris has been a leader in teaching others to skillfully trade in gold, oil, and silver in both bull and bear markets. Subscribers to his service depend on Chris' uniquely consistent investment opportunities that carry exceptionally low risk and high return.
This article is intended solely for information purposes. The opinions are those of the author only. Please conduct further research and consult your financial advisor before making any investment/trading decision. No responsibility can be accepted for losses that may result as a consequence of trading on the basis of this analysis.
Chris Vermeulen Archive |
© 2005-2022 http://www.MarketOracle.co.uk - The Market Oracle is a FREE Daily Financial Markets Analysis & Forecasting online publication.


