


Stock Market SPX Repelled by Cycle Top Resistance
Stock-Markets / Financial Markets 2011 Jan 09, 2011 - 08:19 AM GMT

 The FDIC Starts off a New Year.
The FDIC Failed Bank List announced two new bank closures this week. A subscriber sent me this video on the IndyMac Bank Closure. It appears that the FDIC is doing much more than protecting depositors’ money.
Charting Three Decades Of The Exponential December BLS Seasonal Adjustment
(ZeroHedge) This is the last chart we will dedicate to today's B(L)S non-farm payroll data. It shows nothing less than than just how much of a factor the "seasonal adjustment" has become in every December data series, and is the definitive evidence of why only the most gullible but any credibility in the BLS seasonal adjustment mechanics. Unfortunately far from indicating a one time seasonal adjustment, it is no yet another secular trend policy tool, whose goal is to offset the actual drop in jobs. Indicatively while the number is now well over 2x greater than it was in 2000, the US population has hardly tripled over the past decade, requiring such a dramatic increase in fudge factors.
After Three Weeks, Bond Outflows Reverse As Revised Equity Inflows Barely Budge
(ZeroHedge) Well, that lasted all of 3 weeks: after ICI reported outflows in taxable bond funds for all of the prior four weeks (for a whopping combined $5 billion after hundreds of billions in inflows in the past year), the bond inflows are once again back in the last week of 2010, as bond investors placed $2.5 billion with taxable bond funds. The only category that saw outflows was municipal bond funds...
VIX is testing its 10-week moving average.
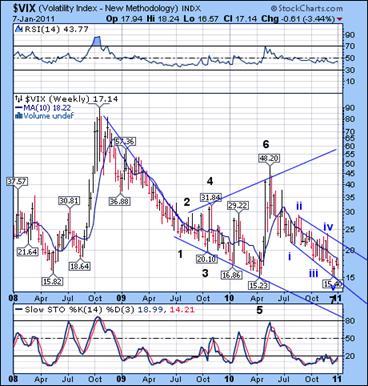 --The VIX tested its 10-week moving average as it emerges out of its 8-month cycle low. The fact that it did not exceed the April low at this 8-month interval adds credibility to the Orthodox Broadening Bottom formation and the thesis for a strong rally beyond prior highs.
A descending Broadening Wedge (point 7) is a continuation pattern that suggests a move at least as long as the prior one from this terminus. Just as VIX gapped up several times in April, we may expect opening gaps as early as in the coming weeks.
.SPX repelled by Cycle Top Resistance.
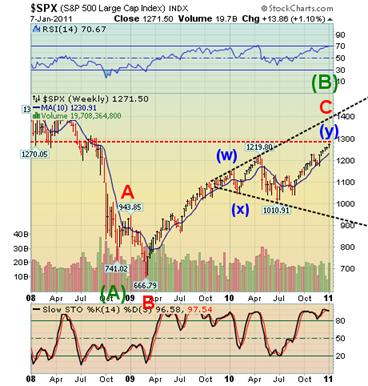 Last week I mentioned that…“the 8-month cycle had its own schedule.” It appears that it may have made its top on January 6th, one pivot later than the expected high on December 23-28. I had also mentioned that the lesser cycles (Pivots) often truncate or extend to meet the 8-month Cycles. In this case, we saw an extension due to the year-end and periodic strength of the first week of the month. The second criterion is that SPX challenged, but closed below its weekly Cycle Top Resistance at 1272.
Smithers & Co. just came out with a new valuation on the S&P. This is one more condition for calling a top.
The NDX closed above Cycle Top Resistance.
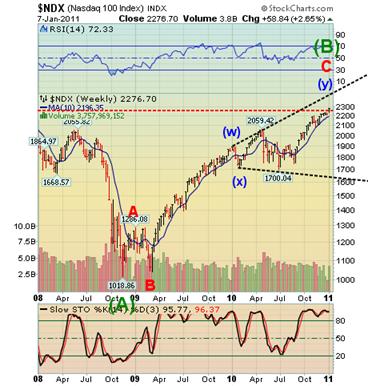 --The NDX closed above its Cycle Top Resistance at 2250.00. It also sold off from its Pivot high and may have created a reversal pattern on the daily and hourly charts. Obviously, this must have follow through right from the start of the week.
Last week was the final extension of the 8-month (top to top) cycle. Although Smithers & Co. did a valuation on the S&P, it would be interesting to see just how overvalued the NASDAQ is.
Gold fell through the 10-week moving average.
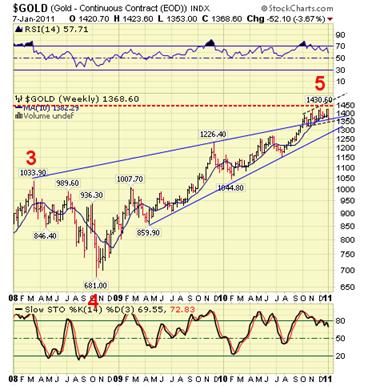 -- Gold declined down from its Weekly Cyclical Top Resistance at 1434.26 in early December and completed a weekly reversal pattern from which it sold off last week. It has challenged the lower trendline of its Broadening Formation at 1365, but has not yet broken through. There is a combination Trading Cycle and Primary Cycle low due January 17-25. Combination cycle lows are usually stronger than average, so the decline may also be deeper than projected.
$WTIC may fall on speculation curbs.
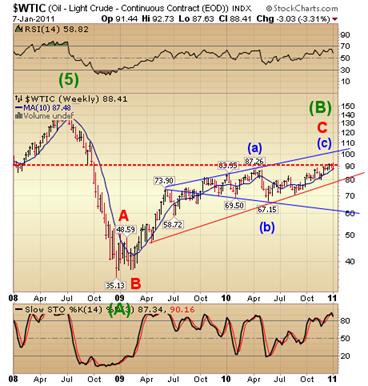 -- After making a new high on January 3, $WTIC sold off the rest of the week, coming to rest on its 10-week moving average. Early in the week it had been challenging its Cycle Top Resistance at 89.98, but closed below it. This has triggered a Cycle Top sell signal. The confirmation will be the drop below the 10-week moving average at 87.48.
Bloomberg reports that the drop in crude is the result of a disappointing jobs report.
Or it could be…The top U.S. commodity regulator will consider a plan next week to curb speculation in raw materials including oil, gold and wheat as part of the most sweeping rewrite of Wall Street rules since the 1930s.
The Bank Index repelled by its Cycle Top Resistance.
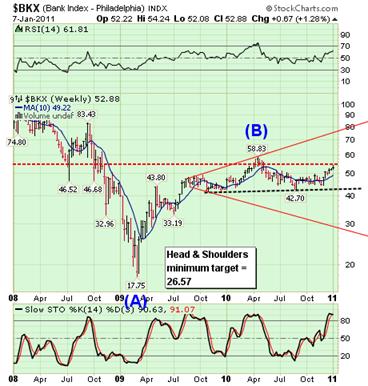 --The $BKX was repelled by its weekly Cycle Top Resistance at 55.02 and formed a probable right shoulder to a massive Head and Shoulders pattern. It, too, made an extension to its 8-month cycle.
(UK) Bank chiefs are preparing to defy ministers' pleas for restraint and award billions of pounds in bonuses this year. Although the payouts are expected to be lower than in the previous year, they will still come as an embarrassment to the Government.
It can’t happen here…can it?
The Shanghai Index is below its 10-week moving average.
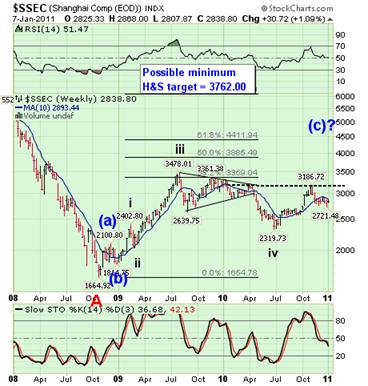 --The Shanghai Index made its Trading Cycle low on its December 29th Pivot. The fact that it hasn’t overlapped its July high at 2705 still suggests it may resume its rally above the inverted H&S neckline. It also remains in the upper half of its daily and weekly trading channel. A move above the 10-week moving average will confirm that the bottom is in.
The Shanghai Composite Index ended the first trading week of the year with a gain of 1.09 percent, closing at 2,838.8 points yesterday. The average daily trading value was 132.83 billion yuan, up 2.94 billion yuan from the previous week.
$USB is still lingering near its lows.
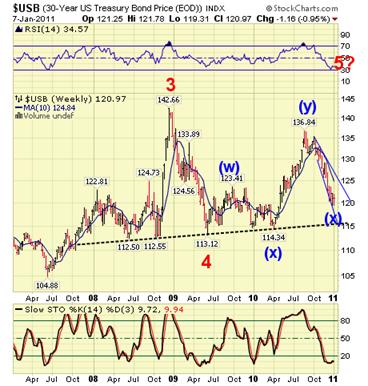 -- Cyclically, $USB appears to be at a major turning point. It has not violated daily Cycle Bottom support at 118.88. At the same time, it is just below weekly mid-Cycle Support at 122.30. It is still within its descending Broadening Wedge, which is a continuation formation. TLT appears to have made its turn on December 15th, within its 8-month window. $USB is still lingering near its lows, making a 1 point lower low last week.
It seems that the bad behavior may be focused on the PDs and their efforts to unload their Treasuries to the Fed.
$USD consolidates before its breakout.
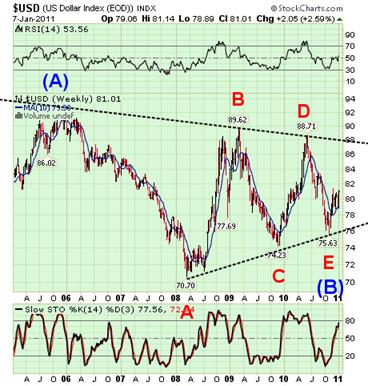 -- $USD closed near its consolidation highs, but has not broken out above its November high at 81.41. It has tested its 10-week moving average at 79.38 and has bettered its mid-Cycle Support at 79.89. The next wave will most likely be a third wave. It may have a target above the top triangle trendline near 88.00, which also activates a potential Head & Shoulders pattern with a projected target at 108.50.
Traders alert: The Practical Investor is currently offering the daily Inner Circle Newsletter to new subscribers. Contact us at tpi@thepracticalinvestor.com for a free sample newsletter and subscription information.
Our Investment Advisor Registration is on the Web
We are in the process of updating our website at www.thepracticalinvestor.com to have more information on our services. Log on and click on Advisor Registration to get more details.
If you are a client or wish to become one, please make an appointment to discuss our investment strategies by calling Connie or Tony at (517) 699-1554, ext 10 or 11. Or e-mail us at tpi@thepracticalinvestor.com .
Anthony M. Cherniawski, President and CIO http://www.thepracticalinvestor.com
As a State Registered Investment Advisor, The Practical Investor (TPI) manages private client investment portfolios using a proprietary investment strategy created by Chief Investment Officer Tony Cherniawski. Throughout 2000-01, when many investors felt the pain of double digit market losses, TPI successfully navigated the choppy investment waters, creating a profit for our private investment clients. With a focus on preserving assets and capitalizing on opportunities, TPI clients benefited greatly from the TPI strategies, allowing them to stay on track with their life goals
Disclaimer: The content in this article is written for educational and informational purposes only. There is no offer or recommendation to buy or sell any security and no information contained here should be interpreted or construed as investment advice. Do you own due diligence as the information in this article is the opinion of Anthony M. Cherniawski and subject to change without notice.
Anthony M. Cherniawski Archive |
© 2005-2022 http://www.MarketOracle.co.uk - The Market Oracle is a FREE Daily Financial Markets Analysis & Forecasting online publication.