Gold Bottom or Breakdown?
Commodities / Gold and Silver 2011 Jan 09, 2011 - 07:51 AM GMT This past week we saw gold have its biggest two-day drop since February of last year ending the third longest streak of trading above its 50-day that the yellow metal has had since 2000. The first streak ended in 2002 with 124 trading days and the second in 2008 with 143 trading days. No bull market goes up in a straight line.
What was the trigger?
Could it have been investors rebalancing their portfolios for the New Year? Worries that an economic recovery will curb demand for the metal as a haven? Reports that U.S. companies added almost three times more jobs in December than analysts forecast? Was it the dollar rising for three days against a basket of major currencies?
We are likely to see much volatility in 2011 as investors swing from fear to greed and back again. There is a relatively new phenomenon mostly discussed on trading floors and by professional managers. It’s called “Risk On – Risk Off.”
It goes something like this. Investors either believe the future is good and risk appetite is ON; or else they believe the future is doom and gloom and risk is OFF. What is different since the Subprime fiasco of 2008 is that there doesn’t seem to be much of a middle ground. Exuberant optimism and gloomy pessimism oscillate nervously within the markets and the prices of a variety of assets move up and down with them.
On this see-saw, when risk is on, equities and commodities rise and credit spreads narrow and the Japanese yen falls. When risk is off, they switch. Correlations between various asset classes that historically hardly moved together are now highly polarized, either strongly positive or strongly negative. If in normal market conditions the price of any given asset is driven by a variety of forces and factors, in today’s markets many assets are being driven by the Risk On – Risk Off phenomenon.
As far as Risk Off side of the equation, there are plenty of worries to keep even a normally sound-sleeping investor awake at night. We have covered them in previous Premium Updates - quantitative easing, sovereign debt, currency wars, euro zone problems, a housing market where one-in-seven mortgages is delinquent or in foreclosure, inflation, deflation, hyperinflation, etc.
Speaking of hyperinflation, if you want to read something that might keep you awake at night read an article by long-time trader and author Victor Sperandeo in the latest issue of Barron's. Sperandeo has traded for many top investors, including George Soros.
He writes that investors in U.S. debt around the world are growing closer to a "psychological breaking point" that could force a "run on the bank" against Treasuries.
If that happens, hyperinflation will quickly follow and gold will soar much, much higher. We have already seen signals from China that it intends to cut its holdings of US treasuries. Anyone who believes that the United States faces a comparatively mild 1970s-style inflation risk is ignoring history at his own peril, says Sperandeo. He writes:
Hyperinflation has a single cause: It occurs when a government cannot borrow money because its debt has risen so much that investors believe they will never be paid back with close to the same purchasing power. As a consequence of this flight of confidence, such a government is forced to print money to meet its obligations. This further undermines the value of its currency, often culminating in a frenzied collapse. That is hyperinflation, and only governments and central banks cause it.
U.S. government debt is now over $13.7 trillion (not including estimated states’ debt of $2.8 trillion and agencies’ debt of $3.0 trillion). The average rollover period for the debt is 49 months. With recent deficits running over $1 trillion a year, the Treasury issues new debt and refunds old debt at a rate of about $4.3 trillion a year. A nation needs to inspire a lot of confidence to keep that Ponzi scheme alive. Unfortunately, markets know that even the U.S. government will print money to meet expenses when necessary.
Investors know that the tiny gap between what they are paid to hold Treasury debt versus the inflation rate can quickly turn into a loss. If the gap narrows by too much, there is no longer any compelling incentive to hold the debt. Investors will rush for the doors not wanting to be left holding the bag.
Meanwhile, there are many voices out there screaming "breakdown in gold", "get out", and "the rally is over". Given such a positive fundamental situation for gold, one would need to be particularly convinced that lower prices are likely before deciding to sell their holdings. Do charts really provide necessary evidence? Let's take a look (charts courtesy by http://stockcharts.com).

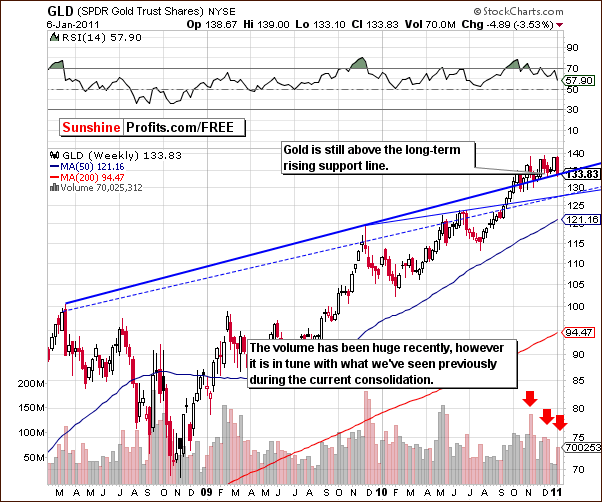
The above GLD ETF chart provides a medium-term view back to early 2008. Gold is seen to be holding above the long-term rising support line. Consequently, the trend remains up, and thus higher prices are still likely from here.
The volume levels have been high lately along with lower prices in the yellow metal, which is generally a bearish signal. Still, it is very much in tune with what we've seen previously during gold's corrections, which were not followed by a serious plunge - they were followed by rallies.
For the above reasons, the sentiment has not turned from bullish to bearish and the price decline was definitely something unexpected. There is always such a possibility, however at this time it can be considered as anomaly.
What about gold from the non-USD perspective?

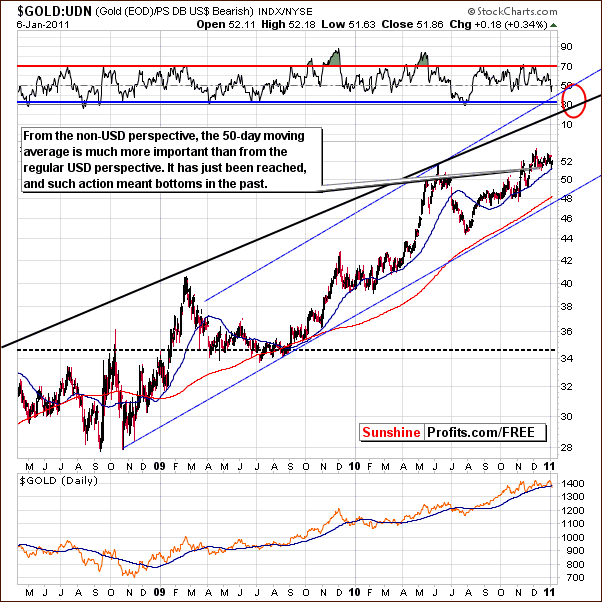
In this week’s Gold:UDN ratio chart (the average of gold priced in currencies other than the U.S. Dollar), we see further confirmation of points made earlier from our regular USD perspective.
In the past month, as in most of last year, the 50-day moving average has provided support, typically being tested at points coinciding with local bottoms for the past 12 months. This is where we find gold’s price today, indicating that a bottom is at hand or is quite close.
The signs are not such that a great deal of excitement should manifest itself at this time, at least not until a breakdown is seen. Since current price levels are not below the levels of recent highs, the breakdown has not yet materialized. Some intra-day price volatility to lower levels has been seen but should not be regarded as significant at this time.

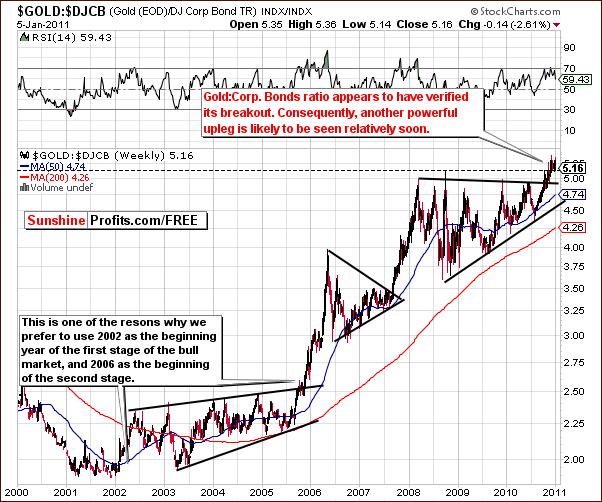
We now look at gold’s price relative to corporate bonds in our final gold chart this week. This index level continues to consolidate at levels above previous highs and therefore the bullish implications, which were discussed in last week’s Premium Update still stand.
Summing up, although much has happened this week, the situation and the outlook for the yellow metal has changed little. Although there may seem to be increased risk with volume levels increasing and gold’s price declining, other signals from a technical analysis standpoint appear bullish. The target level of $1,600 still holds and the upside potential is actually even greater than what has been seen in recent weeks. All-in-all, the risk-reward ratio is pretty much unchanged.
To keep yourself informed about the nitty gritties of the precious metals market, I recommend you to sign up for our free mailing list. Sign up today and you'll also get free, 7-day access to the Premium Sections on the website, including valuable tools and charts dedicated to serious PM Investors and Speculators. Again, it's free and you may unsubscribe at any time.
Thank you for reading.
Mike Stall
Sunshine Profits Contributing Author
Sunshine Profits
Mike Stall is a writer on SunshineProfits.com. He is a commodity analyst in the precious and industrial metals space with a background in quantitative analysis of the financial markets. Mike Stall has been actively associated with studying gold, silver and base metal prices from both a quantitative as well as a fundamental standpoint. Mike Stall believes that commodities are superior investment instruments in comparison with most other asset classes as they tend to perform better in environments of inflation, fluctuating currencies and uncertain equity markets.According to him, the inherent and intrinsic value of a commodity often leads to safer and stronger returns that have been historically proven, fundamentally as well as quantitatively.
Interested in increasing your profits in the PM sector? Want to know which stocks to buy? Would you like to improve your risk/reward ratio?
Sunshine Profits provides professional support for precious metals Investors and Traders.
Apart from weekly Premium Updates and quick Market Alerts, members of the Sunshine Profits’ Premium Service gain access to Charts, Tools and Key Principles sections. Click the following link to find out how many benefits this means to you. Naturally, you may browse the sample version and easily sing-up for a free trial to see if the Premium Service meets your expectations.
All essays, research and information found above represent analyses and opinions of Mr. Radomski and Sunshine Profits' associates only. As such, it may prove wrong and be a subject to change without notice. Opinions and analyses were based on data available to authors of respective essays at the time of writing. Although the information provided above is based on careful research and sources that are believed to be accurate, Mr. Radomski and his associates do not guarantee the accuracy or thoroughness of the data or information reported. The opinions published above belong to Mr. Radomski or respective associates and are neither an offer nor a recommendation to purchase or sell securities. Mr. Radomski is not a Registered Securities Advisor. Mr. Radomski does not recommend services, products, business or investment in any company mentioned in any of his essays or reports. Materials published above have been prepared for your private use and their sole purpose is to educate readers about various investments.
By reading Mr. Radomski's essays or reports you fully agree that he will not be held responsible or liable for any decisions you make regarding any information provided in these essays or reports. Investing, trading and speculation in any financial markets may involve high risk of loss. We strongly advise that you consult a certified investment advisor and we encourage you to do your own research before making any investment decision. Mr. Radomski, Sunshine Profits' employees and affiliates as well as members of their families may have a short or long position in any securities, including those mentioned in any of the reports or essays, and may make additional purchases and/or sales of those securities without notice.
Przemyslaw Radomski Archive |
© 2005-2022 http://www.MarketOracle.co.uk - The Market Oracle is a FREE Daily Financial Markets Analysis & Forecasting online publication.


