The S&P 500 & Gold Under Pressure on Friday
Stock-Markets / Stock Markets 2011 Jan 08, 2011 - 08:13 AM GMTBy: J_W_Jones
 With the holiday season in the rear view mirror and volume slowly creeping back into the marketplace, I can’t help but wonder what lies ahead. The optimist in me is hopeful that the economy will continue to repair itself and the financial issues that plague the federal government, state government, and local governments will just go away as the economy rebounds. The only problem with my hope is that massive debts and deficits do not simply disappear and I fear the problem will be a long and lasting one.
Federal Reserve chairman Ben Bernanke indicated that unemployment numbers are likely to remain stubbornly high for an extended period of time. He also made it clear that Quantitative Easing II was necessary and needed to be continued in a vain attempt to keep interest rates low. Since its inception, treasury rates have done nothing but increase which begs the question whether the program is really doing anything it was intended to do.
In addition to our domestic debt issues, unemployment claims, and poor housing market we find that the crisis in Europe while somewhat muted, continues to manifest in a negative fashion. Nearly every where we look we are surrounded by fundamental issues which directly impact risk assets. These issues have been constant for quite some time and the S&P 500 has shrugged them off and powered higher. The S&P 500 has put on quite a run since the March 2009 lows, and while we have had several corrections and a “flash crash” along the way, we have yet to see a major correction turn into bearish market conditions.
Is price action today an early warning sign that lower prices await us in the equities market. Is the U.S. Dollar going to breakout above the 50 period moving average and challenge the 83 price level on the weekly chart?
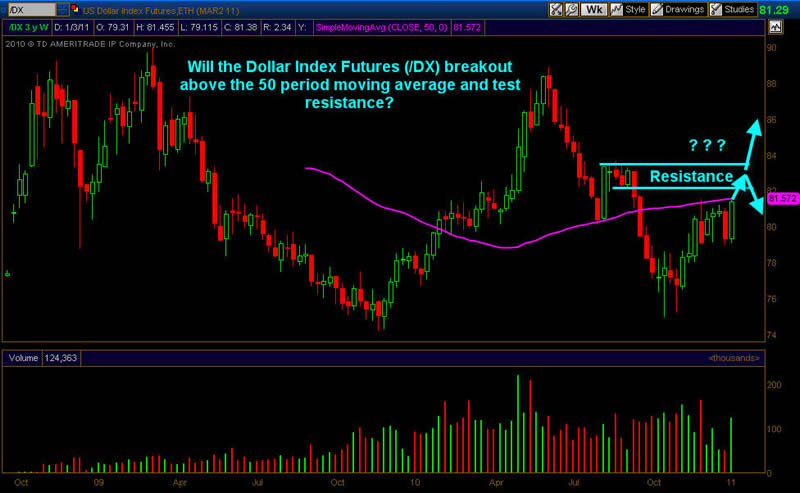
If the resistance zone listed on the weekly chart failed the dollar would seemingly be poised to test the triple tops around the 88-89 price level. Quadruple tops is not a technical pattern that is recognized by many traders as the 4th mouse typically gets the cheese. The flip side would offer that if resistance around the 83 price level holds and the Dollar plummets risk assets would move higher. It is too early to tell what is going to happen, but active traders need to be monitoring the U.S. Dollar Index closely as it will provide clues as to the direction of the S&P 500 and gold.
S&P 500
Friday’s market action is indicative that lower prices may be awaiting us in coming days and weeks. A reversal has been potentially carved out, but it remains to be seen if a top is in. Picking tops in a long term bullish trend is a fool’s game as bullish advances can be overbought for long periods of time as they advance higher. What is evident is that prices are being pushed lower and strong selling volume is confirming the potential for a longer term reversal. It is too early to tell if the price action is just working off overbought conditions or if this is a change in price action and market direction. The daily chart of the SPX illustrates the possibility that a reversal or the potential for an intermediate term top to be in.
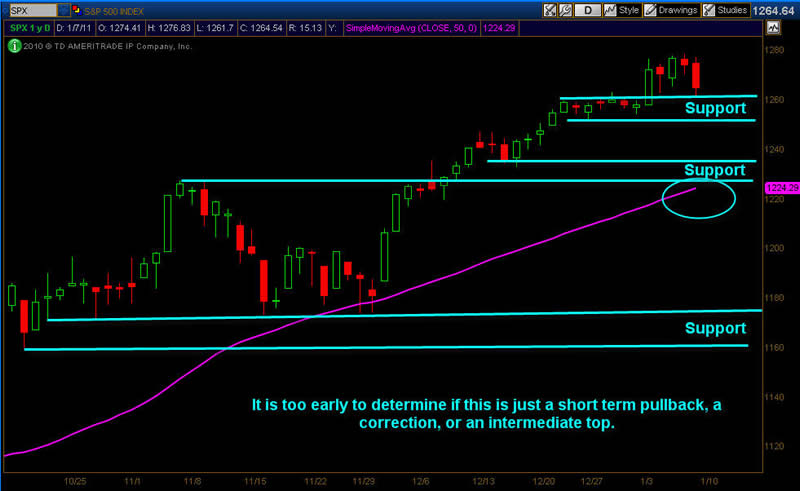
The S&P 500 has tested the first support area around 1,260 today and it bounced which is typical price action. The question will be whether price will drift higher the rest of the day and close modestly lower, or if selling pressure will hold prices down near the lows of the day. In the recent past, Friday morning selloffs led to a drift higher that by the sound of the closing bell prices were flat or only slightly lower. Will today be different?
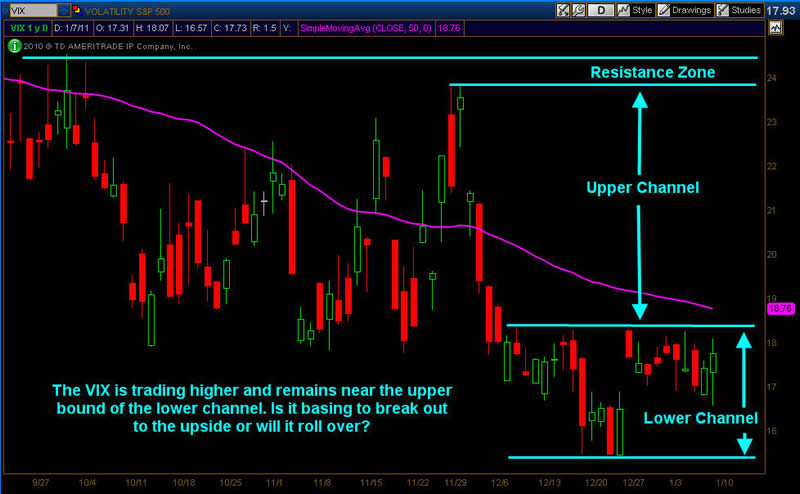
There are a few confirming signals that prices may continue lower. Recently Fridays have had relatively low volatility and light volume with the propensity to grind higher through the afternoon session and into the close. While the grind higher remains to be seen, volatility is rising. The Volatility Index (VIX) is trading nearly 3% higher on the day and is trading around the 18 price level as can be seen in the chart below. Price action remains at the upper bound of the lower channel. A breakout in the upper channel could result in additional selling pressure should that occur.
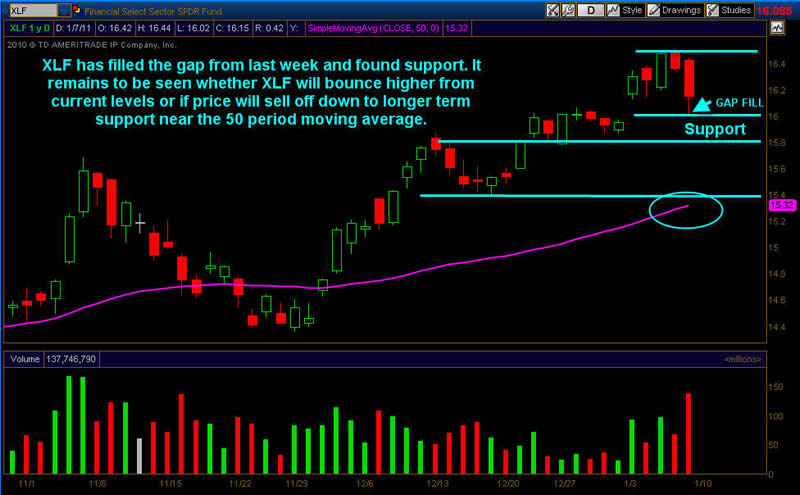
Another telling sign that additional sales pressure may be lurking next week or in the near future is the price action in the financials. The ETF XLF is currently trading down about 1.60% on the day and has completed a gap fill from last week. Price bounced as is typical, but selling pressure remains strong. If the financials continue to probe lower in coming days and weeks the S&P 500 will follow in suit.The daily chart of XLF is shown below.
In the end, it is simply premature to determine what the price action taking place today in the S&P 500 will lead too. We could see a drift higher this afternoon back to near break even which has been common in the recent past. We could see prices consolidate at current levels or we could see continuation selling with an intermediate term top being put in. At this point, all we can do is wait and see what happens. As I have said before, adjusting stops and taking profits is likely a sound strategy until we know more regarding the price action in the S&P 500 next week.
Gold Futures
Most gold bugs are expecting an outright U.S. Dollar meltdown. What if they are wrong? If you ask them the dollar is surely going to get destroyed and our way of life and standard of living is set for major changes. I do not know for sure what is going to happen, but if the crowd says the Dollar is sure to get killed, the contrarian trader in me wants to get long the dollar in a trade with a good risk / reward setup and defined risk.
If we look at the gold futures it is obvious that they are moving lower and a serious correction could be taking place. If gold futures break down below the 1,330 – 1,315 support area a full fledged correction of 10% or more could take place. The next major support level in gold futures would be around the 1,250 area. The daily chart of gold futures illustrates the key price levels that are currently in play.
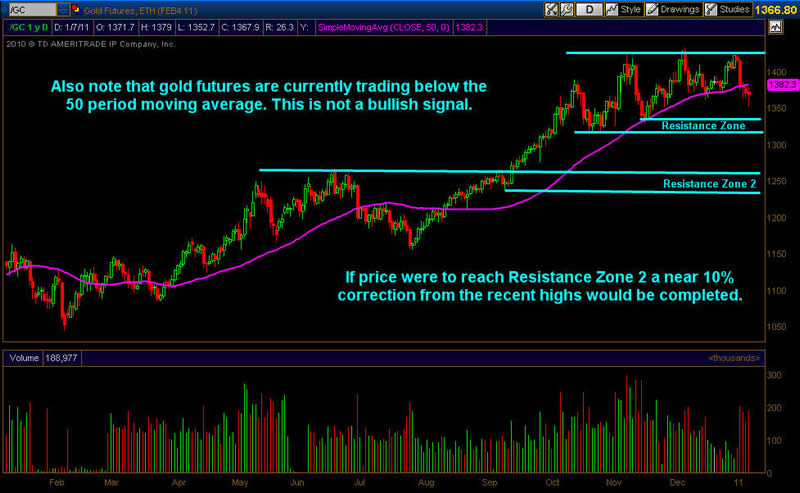
Gold has already pulled back quite a bit from the recent highs, but time will tell how deep the pullback in the shiny metal will be. At first glance I would expect more carnage here simply because of how bullish the retail crowd is regarding gold. Longer term gold will likely remain in a bull market, but for those that took profits and have waited patiently gold could give us a solid risk / reward entry. The traders and investors that purchased above the $1,400 an ounce price point have either stopped out or their money is currently trapped. If prices go low enough, those trapped traders will eventually capitulate near the lows. If history serves us well, just about the time the last remaining weak gold bull gives up will be right around the intermediate term bottom.
Its hard to say what is going to happen on Monday or later next week, but based on the price action today it is going to be anything but ordinary. At this point I do not have a clear edge as to what is going to happen in the S&P 500 or gold. What I do know is that they are both under fire and the confirming signals in the VIX and financials is worthy of note. While I will not be jumping into either asset class with fresh capital, I will be watching closely to see if a low risk setup presents itself. Instead of trading based on a feel, a prediction, or a bias I intend to patiently wait to see what transpires next week before putting any capital at risk.
Have a great weekend!
If you would like to continue learning about the hidden potential options trading can provide please join my FREE Newsletter: www.OptionsTradingSignals.com
J.W. Jones is an independent options trader using multiple forms of analysis to guide his option trading strategies. Jones has an extensive background in portfolio analysis and analytics as well as risk analysis. J.W. strives to reach traders that are missing opportunities trading options and commits to writing content which is not only educational, but entertaining as well. Regular readers will develop the knowledge and skills to trade options competently over time. Jones focuses on writing spreads in situations where risk is clearly defined and high potential returns can be realized.
This article is intended solely for information purposes. The opinions are those of the author only. Please conduct further research and consult your financial advisor before making any investment/trading decision. No responsibility can be accepted for losses that may result as a consequence of trading on the basis of this analysis.
© 2005-2022 http://www.MarketOracle.co.uk - The Market Oracle is a FREE Daily Financial Markets Analysis & Forecasting online publication.


