America’s Second Great Depression 2010 Year-end Update (Part 2)
Economics / Great Depression II Dec 28, 2010 - 02:08 AM GMTBy: Mike_Stathis
 I continue where I left off from Part one of this report. [1]
Ever since the summer of 2009, economists from both Washington and Wall Street have told us that an economic recovery was in progress, but the data reveals a strikingly different picture. Some even insisted that a recovery began in late spring. You should note the source of these claims, as well as their agendas, so as to determine the underlying motives for disseminating this propaganda.
Regardless whether we point to the spring, summer or fall of 2009 or even 2010, the facts remain the same. There has been no real progress made in the economy. In fact, the actions taken by Washington, the U.S. Treasury and the criminal Federal Reserve Bank have assured the effects of this depression will persist for decades.
As the data shows, this “recovery” has been the slowest of any previous recession stretching back to the Great Depression.
How may we account for this?
The answer is simple. The recession has not ended.
The first recession of America’s Second Great Depression is now in its 37th month. I discussed this in September and have been providing much more detail as well as investment guidance in my newsletter. [2]
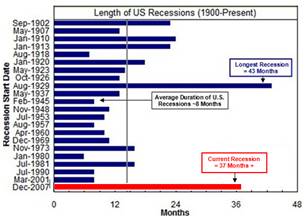
In this, the second of a three-part year-end wrap-up, I will go over some of the recent housing and unemployment data and provide an analysis, hoping to provide you with a better understanding of things.
Housing Market
As you can imagine the U.S. housing market remains in terrible shape. Understanding the housing market is critical for construction companies and their suppliers, as well as local businesses. However, they have all been misled by incompetent analysts who resemble cheerleaders more than experts. Over the past two years I have discussed just how wrong the so-called experts have been in their forecasts. [3] [4] [5]
As I have discussed in numerous publications, various individuals have been selected by the media as the “go-to experts” ONLY because they serve as cheerleaders for Washington. When one examines their track record, it becomes clear they cannot be relied upon for accurate, unbiased insight. We’ve seen the same song and dance when it comes to investment analysis as provided by the media’s so-called “experts.” And we cannot forget about the Internet, where anyone with a PC and Internet connection is now a leading authority on the economic collapse. [6]
A few months ago I presented a big picture analysis of the U.S. housing market. In that article I discussed the fact that even the media’s top “expert,” professor Robert Shiller, really has no idea what’s going on in the housing market. [7]
Even though Shiller has not been a very reliable source for guidance on the housing market, others have been a complete disaster. [8] [9] [10]
Let’s examine some of the recent data.
From the October data, sales of previously owned homes rose to 10% in September to an annual rate of 4.53 million units, outpacing consensus estimates of 4.30 million units. However, this upside surprise did nothing to erase the losses recorded in the summer months. To put this into perspective, under a normally healthy economy, annual sales of previously owned homes are around 5 million units.
After a 1.9% decline in existing housing inventory, the number of residential homes for sale in the U.S. now stands at 4.04 million units. This represents about an 11-month inventory based on the current sales pace. This number does not include the shadow inventory, or some 2 million foreclosures in progress, as well as homes with significant default notifications.
Finally, by my estimates there are several million properties that homeowners are waiting to sell once the housing market improves. Now combine this with millions of baby boomers set to scale down to retirement communities and condos over the next couple of decades. And we cannot forget that mortgage rates will inevitably rise—significantly, which will put downward pressure on housing prices.
What this means is that the housing inventory is likely to remain high for many years. This also means median home prices will fall further, and thereafter remain near current levels for several years. While builders will have some influence in these trends, it won’t be much.
When you consider that 30-year mortgage rates are the lowest on record and have continued to make new lows for several weeks over the past two years, yet the housing market remains extremely weak, this really tells you things are not improving.
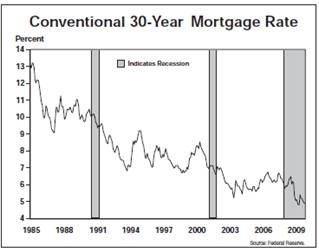
Even worse, the recent surge in Treasury yields is putting upward pressure on mortgage rates, despite the intended actions from the Fed’s quantitative easing program. In fact, government bond yields of virtually every major economy have soared ever since the Fed announced the commencement of its latest round of quantitative easing.
Why might this be?
The reason is simple. The big money realizes that the Fed is fueling a trend of global inflation. And only a fool would want to be stuck holding bonds when interest rates rise. I will get back to inflation in Part 3.
For September, foreclosed properties accounted for 23% of total home sales, while short sales made up another 12%. Combined, distressed property sales were up slightly from August. The percentage of foreclosed properties on the market ranges from 20% to 25%.
As you can imagine, investigations into illegal foreclosure activities by banks could slow any signs of progress in the housing market, as banks delay entering foreclosed properties and short sales. Already, these investigations are thought to have caused many buyers to hold off on purchases in fear they might purchase a foreclosure that will later be taken back by the bank and returned to the previous owner.
In my opinion, extensive coverage of this “foreclosure gate,” as it has been termed, is merely a distraction to keep Americans focused on smaller issues. We still have not seen any of the Wall Street banking executives face criminal investigations for securities fraud. This remains as the biggest unresolved issue in the nation today.
Even Angelo Mozilo, former CEO of Countrywide recently settled with the SEC to the paltry sum of $67.5 million, much of which will be paid for by Bank of America. From 2002 to 2006, Mozilo landed nearly $400 million in salary and stock compensation, including millions of dollars (in excess of the amount of the SEC settlement) from stock he dumped just prior to the collapse of Countrywide. This bailout by Bank of America shareholders allows Mozilo to escape facing charges of insider trading. This is preposterous.

I find it quite ironic that Mozilo has been rubbing shoulders with one of Michael Milken’s “philanthropic” organizations. As you will recall, Milken was labeled the junk bond king after pleading guilty to numerous counts of insider trading and other forms of securities fraud, resulting in billions of dollars of fraud during the Savings and Loan Crisis in the 1980s. In exchange for retaining some $500 million, Milken served a couple of years in club fed. [11]
While the SEC desperately works on a PR campaign of its own, the fact is that no improvements have been made by this agency. It’s business as usual, much like the same with Wall Street and Washington. [12] [13] [14]
As much as Washington has shielded the criminals responsible for collapsing the global economy, they have also been desperate to restore as much optimism about the economy as they can muster. Sales of new homes improved In September after the worst summer in nearly five decades. But this is merely a blip in activity. New home sales in September grew 6.6% from a month earlier, to (seasonally) adjusted annual sales of 307,000.
Even with the increase, the past five months have been the worst for new home sales dating back to 1963. New home sales have risen 9% from the bottom in May but are still down 78% from their peak annual rate of nearly 1.4 million homes in July 2005.
It’s going to take many years to reach the normal pace of new home sales of around 600,000. Americans actually have to qualify for mortgages now. And builders are competing with millions of foreclosures and other distressed properties. This overhang promises to persist for years.
The number of unsold new homes on the market fell to 204,000, the lowest since July 1968. This data reflects the fact that builders finally understand just how bad the housing market is. As low as this inventory remains, it would still take eight months to deplete the current supply of new homes given the current pace of sales. The normal inventory is about a 6-month supply.
The next two charts point to the severity of the U.S. housing market turmoil. One out of every 22 homes with an outstanding mortgage in the U.S. is in foreclosure, a rate up by nearly 500% prior to 2007. Meanwhile, 1 out of every 10 mortgages is past due.
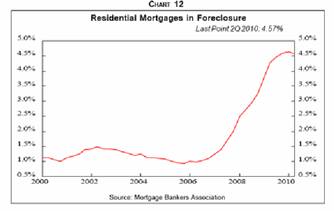
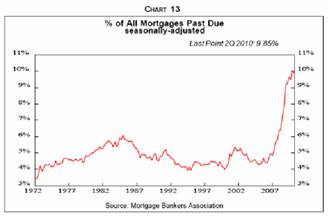
In short, the housing market is showing no signs of stabilizing. I expect only about another 10% decline in median homes to essentially erase previous gains made due to the housing tax credits provided by Obama in 2009-2010.
Despite all of the previous optimism by Washington, the Federal Reserve and Wall Street, as of late, these same sources are now expecting the recovery to be slow. This so-called post-recession recovery has not been this slow since 1946. Once again, this can be explained by the fact that the recession is still ongoing. High (but understated) unemployment numbers, a miserable housing market, and overall sluggish business and consumer activity confirm this. It is the first of at least one more recession that we shall experience throughout this economic depression.
Now that the various housing subsidies have ended, it is a much more difficult task to mask the housing picture. In November, the Census Bureau reported a massive one-month drop in the median price for new homes, from $226,300 in September, to $194,900. This 13.9% collapse in price represents the lowest price since October 2003 when media home prices stood at $194,100.
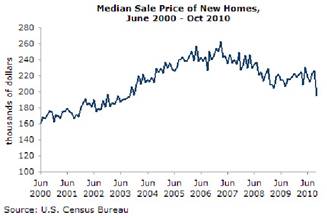
Furthermore, the 20-city Case-Shiller Index also fell by 0.7% in October, with only Las Vegas and Washington DC posting modest gains. Once you consider that Las Vegas has suffered one of the most severe drops in real estate prices since 2007, it is reasonable to see a few upbeats here and there. Finally, it should be easy to appreciate that the government workers in DC have plenty of your money to buy houses.
Because the Case-Shiller data consists of three-month average sales prices that end two months prior to the release of the data, this index lags that of the new home sales data. Thus, there is a good chance that the Case-Shiller data will show large declines over the next couple of months. That means prices are likely to sink lower.
Interestingly, the recent price declines are being led by the lower end of the housing market. This is largely in contrast to what we have seen over the past couple of years. However, I expected this to occur given that lower-priced home purchases received a higher percentage tax subsidy under Obama’s tax credit program since the tax credit was fixed regardless of the cost of the home.
Furthermore, as one might expect, first-time homebuyers tend to purchase lower-end homes. Without these tax credits, the demand for new homes simply isn’t there.
Sadly, if we look at the data, it appears as if many homebuyers who jumped into the market to take advantage of the tax credit would have been better off waiting because these homes are selling for much lower prices now.
As stated several months ago in the newsletter, in effect these tax credits only helped sellers and especially the banks because it transferred the risk of mortgage defaults to individuals who have been held to higher credit scrutiny.
Recently, I came across a press release discussing that foreclosures accounted for 25% of home sales or 188,784 units during the July-September period of this year.
“Foreclosures made up 25 pct of US home sales in 3Q”
The problem is that unless you read the entire article (which wasn’t particularly short) many might have been led to believe that this represented an uptick in foreclosure sales.
Understand that many investors (especially traders) read headlines rather than the entire article because it allows them to absorb more news bits as they look for trading catalysts.
Only later does the article discuss the fact that this 25% rate actually represents a collapse in foreclosure sales. However, nowhere in the article does the reporter remind readers that between 2008 and late 2009, foreclosures accounted for about 50% of total home sales. Knowing this puts things in perspective.
Finally, it’s also important to note that foreclosures normally account for less than 2% of total home sales. This should give you an idea why builders like the now combined Pulte-Centex Homes, KBH, Lennar, DR Horton and others are struggling so much.
Foreclosure sales as a percentage of total home sales fell to 25% in Q3 versus Q2, and 31% from Q3 2009.
A few months ago I discussed (in the AVA Investment Analytics newsletter) the likelihood of a drop in foreclosure sales due to the confusion over the handling of the legal foreclosure process by banks. The problem is that I don’t think the current data reflects this. Q4 data is likely to collapse further as the full effect of this controversy is felt.
Prior to the foreclosure gate as it’s been labeled, foreclosures accounted for around 30% of all home sales in 2010. By now you should understand why foreclosure sales have declined from the previous two years. Quite simply it relates to supply and demand. Foreclosures have continued to flood the market, outpacing demand. This has been demonstrated by the collapse in sales prices for foreclosures, averaging $169,523 or 32% below the median sales price of non-distressed homes; a five-year low. You should expect this gap to widen as more foreclosures flood the market. Any further delays in the foreclosure controversy are likely to exacerbate the decline.
Nevada continues to lead the nation in the percent of foreclosure sales and has remained over the 50% pace for two years, although this pace has dropped somewhat in 2010. Arizona and California come in at the second and third spots respectively.
As the next chart shows, after mounting a small uptick in housing starts a few months ago, builders have once again reigned in new projects. Looking back, we see that housing starts are the lowest on record.
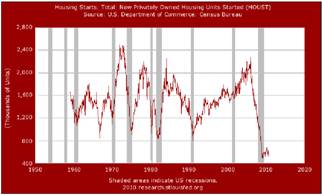
And of course we cannot forget about the wave of mortgage resets coming due in 2011. After accounting for the shadow housing inventory, I estimate about a 2-year inventory in homes. Furthermore, any improvements in the housing market will be neutralized for many years by the flooding of homes that will be put on the market by owners who have been waiting for pricing to improve.
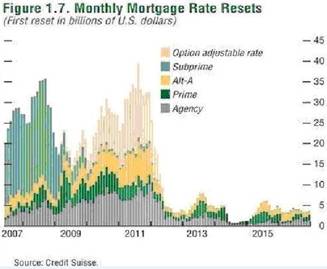
Finally, only modest gains are likely even after 2020 for many years, as baby boomers downgrade to retirement communities, condos or move in with relatives. As the housing market continues flounder, you should expect another housing stimulus by Obama, but like the previous ones, it isn’t going to help anyone other than the banks and maybe the sellers.
Employment Picture
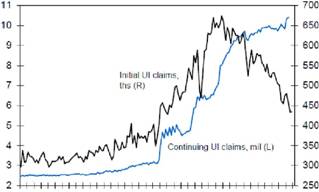
It’s been 19 months since the “official” end of the worst recession since the Great Depression, yet we still have seen absolutely no signs of a recovery in the job market. In fact, the unemployment rate rose last month after being stuck at 9.6% for several months. Even more revealing is the very long average duration of unemployment, as shown in the next graph. Are these trends one would expect from a recovery?
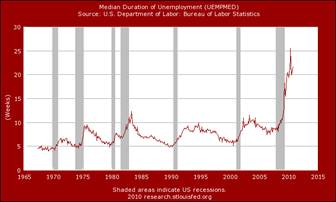
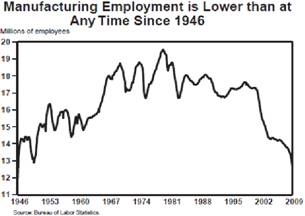
While the U.S. certainly is not shedding jobs at the pace seen in 2009, the big problem is that companies simply aren’t hiring, at least in the U.S. Manufacturing in the U.S. faces a similar fate as the middle class; permanent extinction, as jobs continue to be jettisoned to Asia and Latin America. U.S. corporations are not investing in new projects domestically, and banks are not lending despite being given trillions of dollars in loans at close to no cost. Rather than requiring banks to make loans, Washington lines up to the demands of the Federal Reserve.
Meanwhile, politicians talk tough when the camera is rolling so as to score points for the next election. Sadly, this circus act continues to fool most Americans. The fact is that all of Washington has served a complicit role with Wall Street and the Federal Reserve in the theft of the nation. While this has been going on for a very long time, we are now witnessing an acceleration of these activities at the worst possible time.
Why lend money and exposure your bank to risk when you can borrow money from the Fed for practically nothing and use it to buy risk-free U.S. Treasuries with yields north of 3%?
This is nothing short of massive fraud by Washington and the Federal Reserve and its shareholder banks. And you are paying the price. As a result of this fraud, your money and loss of economic opportunity are going towards the Christmas bonuses of the Wall Street and banking executives.
Let’s see if the genius Ben Bernanke has a reasonable explanation for the high and lingering unemployment rate. Of course he is a genius because the media says he is; the same media that praised the “genius” of Alan Greenspan for years.
According to Bernanke,
The "bulk of the increase in unemployment is attributable to the sharp contraction in economic activity rather than to structural factors.” [15]
As you can imagine, Mr. Bernanke has it all wrong. This should come as no surprise to those who have documented his forecasts over the past three years. Remember, this is the same Ben Bernanke who in the spring of 2007, insisted that the real estate market was fine. A year later, Bernanke insisted that any potential problems in the real estate market would be contained and would not spill over into the general economy.
This is the same Ben Bernanke that worked on a scare tactic pitch with Hank Paulson in order to secure an unconstitutional banking bailout. This is the same Ben Bernanke that knew in advance about the massive losses held by Merrill Lynch when he went to Bank of America and forced Lewis to buy the brokerage firm. This is the same Ben Bernanke that worked alongside New York Federal Reserve President Tim Geithner to secure a massive bailout for AIG in order to prevent Goldman Sachs from losing at least $20 billion.
In addition to dozens of other specific forecasts I made in America’s Financial Apocalypse I predicted a median house price decline of 30% to 35% from peak levels reached in mid-2006. The book was released in late 2006. This is close to where we are today. So who are you going to trust for unbiased insight? Me or Ben Bernanke? [16]
As you can imagine, there have been no real improvements to the U.S. housing market in 2010, despite claims made by the establishment (Washington, Wall Street, real estate shills, the media, academic economists and others tied into the system). [17]
So what’s the real reason for the long duration of high unemployment? It is the result of structural issues, namely America’s disastrous trade policies. The results of this misaligned arrangement have been devastating for all except top earners and corporate profits.
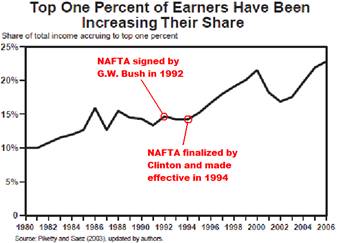
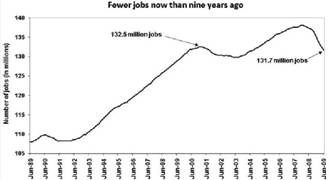
As the next chart illustrates, job creation has been in decline over the past decade even before the economic crisis.
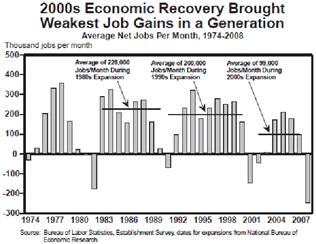
Although disadvantageous trade policies have led to an exodus of jobs from the U.S. for many years, the camel’s back finally broke in 2001, after the dotcom bubble popped. By then, China had entered the World Trade Organization. Shortly thereafter, China began to peg its currency to the dollar to ensure strong exports to the U.S. irrespective of how much the dollar declined.
Towards the end of 2001, the attack on the World Trade Center caused investors to reign in their delusions of limitless economic growth that were ubiquitous during the great bull market of the 1990s. Thereafter, the economic pendulum swung from the U.S. to emerging nations, compliments of unfair trade. This system of unfair trade was established because it benefits U.S. corporations. The problem is that U.S. workers have been the sacrificial lamb of free trade. In contrast, emerging nations have shared this economic prosperity with corporate America. Since 2000, anywhere from 5 to 8 million U.S. jobs have left U.S. soil and landed in China.
As his only alternative to stimulate a sinking economy, by 2004 Alan Greenspan had smashed interest rates to a then record of 1%. This alone facilitated the formation of a real estate bubble, all while further expanding the credit bubble, as I discussed in America’s Financial Apocalypse. But the effects were not confined to the U.S. due to the dollar’s standing as the universal currency of exchange.
When the real estate bubble popped, all the economic growth and jobs created as the result of this bubble quickly vanished. It was an illusion fueled by credit. While this economic storm is by no means finished, the scope and magnitude of the devastation is already many orders of magnitude larger than that seen as the result of the dotcom collapse.
Because most of the jobs created during the asset bubble were not based on sound fundamentals, the high unemployment currently seen is not a reflection of a business cycle contraction. It is a reflection an economy that no longer has the benefit of an asset bubble. This is specifically why Washington and the Fed continue to reflate the bubble.
Meanwhile, the duration of high unemployment is a refection of structural deficiencies in the U.S. economy. Thus, either Bernanke has no idea what he is talking about, or else he is lying in order to protect corporate interests. I detailed the trade and labor problems extensively in America’s Financial Apocalypse.
Corporate powerhouses and Washington officials (who have been bought off by corporate interests) do not want Americans to understand the real problems. This is one reason why the book was banned by publishers and I continue to be black-balled by America’s corporate media monopoly, which includes the Internet.
Conduct a search for my articles and you will see them on maybe two or three sites, while others lacking credentials have their articles plastered on hundreds of sites. Why might this be? Websites make money from ads and they don’t want the truth because advertisers will pull their ads if say, people realize the truth about gold. They want their game to continue uninterrupted. Keeping me out of the loop ensures they will make more money. The problem is that they are making money at YOUR expense through disinformation.
It appears as if they will win this game because the media continues to distract from the main problems, all while feeding its audience with extremists, all while leading the tea party into the hands of the Washington Mafia. It’s truly a dog-and-pony show. And most Americans remain oblivious as to what is happening. You need to understand that your “heroes” are laughing all the way to the bank, all while pleasing their corporate sponsors. [18] [19]
The ONLY solution to the unemployment problem is to restructure free trade agreements so that trade is fair for the U.S. You cannot have a system of fair trade when your trading partners play by different rules. And without fair trade, jobs will continue to be sent overseas. I do not expect trade agreements to be restructured adequately because corporations care only to find the cheapest labor, regardless of the location.
Regardless whether you have democrats or republicans in charge of the game, you need to understand that when it comes to corporate interests, they are in complete agreement; good U.S. jobs will continue to be sent overseas. This is the issue that should be the focus. Nothing else matters when put into perspective. [20]
By no means am I the only individual that points to structural economic problems as the root cause of the current depression. However, others who have previous highlighted trade disparities as the cause of America’s decline have since sidelined the topic in order to show support for the democratic presidency. When Bush was in office, these individuals were anxious to blame trade issues on America’s problems. Now that Obama is in office, trade issues are rarely mentioned by these same individuals.
Even Washington’s most loyal cheerleaders (economists) don’t expect the U-3 unemployment rate to drop below 9% for some time. That alone indicates the unemployment rate is likely to rise. Folks, you cannot have a jobless recovery as the so-experts claim we are witnessing. Jobs are the driving force behind economic growth. Anyone who states otherwise is either a liar or a damn fool.
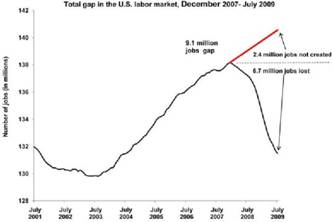
Since the official start of the current recession (December 2007) nearly 9 million jobs have been lost. Unfortunately, most of these lost jobs simply aren’t coming back. I discussed this early last year in an article called "It's Time to Face the Facts.” Since then, even many economists have made this admission. [21]
The only jobs that will return are those that no one wants; the low-paying, dead-end jobs, offering little or no employee benefits. It’s the same situation that played out after the dotcom collapse. This partly accounts for the fact that there has been no real recovery since 2001.

So let’s have a look at some recent employment data.
After coming off of a respectable job gain of 172,000 for October, on December 3rd, the Labor Department reported disastrous numbers for November. Last month, employers added a total of only 39,000 net jobs, falling well short of the 150,000 estimate by the geniuses of the world, economists.
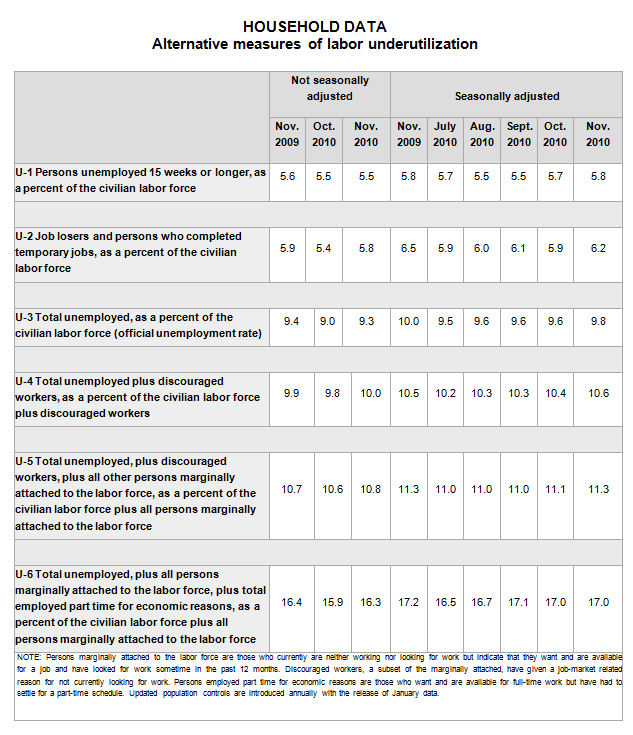
The lack of new jobs bumped the U-3 unemployment rate up from the 9.6% mark where it has stood for several months to 9.8%. The U-3 is now at a 7-month high and has exceeded the 9% mark for 19 straight months; the longest streak on record.
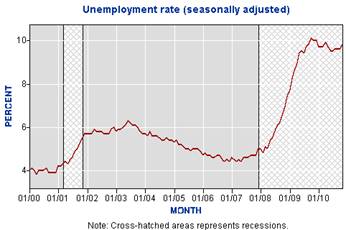
Several months before the latest uptick in the jobless rate, most economists stated that they expected unemployment to remain firm at 9.6%. As a result, economists also lowered estimates for job growth over the next four quarters. This means more Americans will continue to slip into the discouraged worker category which is not counted by the U-3 data.
For November the U-6 unemployment rate (which measures the U-3 plus those working part-time but want full-time work plus discouraged workers) came in officially at 27 million. My own estimates top 34 million.
Note that the U-6 does NOT say anything about work week hours, nor does it state anything about underpaid workers, or workers who are being paid lower wages than their skills, education and experience dictate.
For November, 1.3 million new discouraged workers were added to the total pool, which is now officially 6.3 million.
Despite the record $2 trillion of corporate cash sitting on the sidelines, corporations refuse to offer good jobs to Americans. Instead they continue to hire overseas although the media is not reporting this. The only jobs being offered to Americans are those most people don’t want.
Washington refuses to address unfair trade policies that have sent millions of jobs overseas because U.S. corporations are recording huge profits as a result. In the third quarter, corporate profits hit a record-high at an annual rate of $1.659 trillion, surpassing the previous $1.655 trillion record-high made prior to the economic collapse in the third quarter of 2006. In addition, the recent earnings of U.S. corporations accounted for 11.2 of the economy, second only to the forth quarter of 2006 when that number topped 11.7%.
Private firms created only 50,000 jobs in November, the fewest since January and down from 160,000 in October. This ends the 11-month streak of growth in new jobs.
Even worse, no new jobs were added in five sectors. Stores cut above 28,000, factories 13,000, financial companies 9,000 and construction companies 5,000. Government eliminated 11,000 jobs (mostly at the local level). Healthcare added 19,000 jobs, temporary firms added 40,000, education added 6000, and hospitality added 11,000.
The main problem here is that too few jobs were cut in the financial industry and the government in my view. Many (although clearly not all) government jobs are little more than welfare, disguised as employment. The financial industry still remains much too large. And let’s not forget that this industry creates very little real value. Over the past thirty years, the U.S. has been transformed from a manufacturing powerhouse that supplied the world with high-quality goods, to a nation dominated by financial giants focused on issuing high-interest loans and manipulating the capital markets in order to siphon off the wealth of hard-working Americans.
Also noteworthy in November was expiration of up to 99 weeks of extra aid to nearly 2 million jobless Americans. Recently, this has been extended for one year. Moreover, Social Security taxes have been cut for a year. In exchange, republicans insisted on an extension of Bush’s 2001 tax cut for the wealthy.
While most Americans have been fooled to think that democrats or republicans are on their side, the fact is that this back and forth bickering only serves to draw in votes. It does not matter whether democrats or republicans are in charge of the Washington mafia. Americans will get the same results regardless for issues that matter the most; securing good jobs. In reality, both parties are destroying America’s future, much as they have for decades. This latest stimulus package is nothing more than a poorly designed economic stimulus plan that does nothing more than increase the severity of America’s long-term economic problems.
Two years ago, I predicted that there would be numerous economic packages and bailouts. After Obama signed the ARRA, I predicted it would be the first of many installments. The recently passed tax and employment benefits package is estimated to cost $900 billion over the next two years, which is more than the ARRA. In addition, most of this money will be spent for the estate tax provisions and for AMT adjustments.
While the ARRA was largely a waste of tax dollars, this recent package is a complete waste. And it will only make the consequences of America’s Second Great Depression more severe. Stay tuned, because you can bet that Washington will do more to worsen the severity of the depression, all while sending even more money to the wealthy.
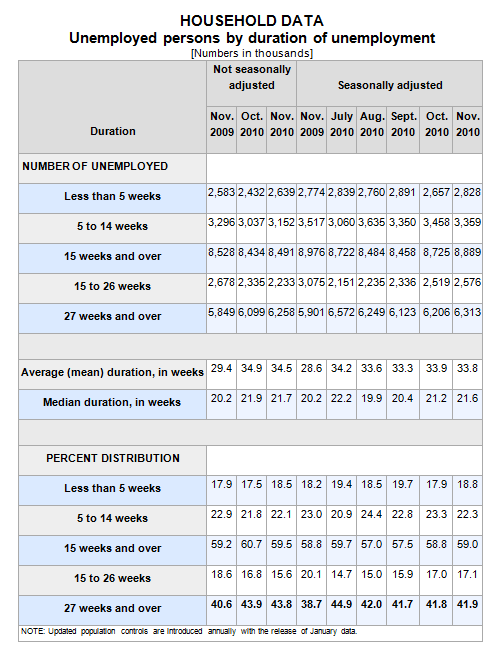
As the next table reveals, more than 40% of America’s jobless have been unemployed for more than 6 months. This trend has lasted for over one year. This is truly a devastating trend that has not been adequately addressed by the media.
In the past, I have discussed the fact that being unemployed for longer than 4 months greatly increases the chance that a person will have to change careers. Thus, it seems very likely that millions of jobless Americans will be required to make a career change, most likely with reduced wages WHEN they are able to finally secure employment.
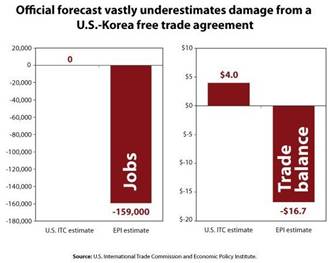
Instead of restructuring free trade policy, as Obama promised in 2008, he has continued where Bush left off by expanding trade to South Korea and other nations, all under conditions that do nothing to protect U.S. jobs. This is disturbing, given that America’s jobless rate remains as the single most significant threat to an already weak economy.
Recently, Obama signed off on the largest U.S. trade deal since the 1994 signing of NAFTA. Obama has been informed by his “trusted advisers” that the South Korean trade deal will “support” at least 70,000 U.S. jobs. In other words, it is not expected to necessarily create any new jobs, but prevent the loss of these jobs. As you can imagine, there is no way to determine whether or not the deal will save jobs. The only way to determine the effectiveness of any trade deal is to count how many new jobs were created.
I will guarantee you this trade deal will create many more jobs in South Korean than in the U.S. In fact, the deal was backed by several U.S. conglomerates such as Citigroup, J.P. Morgan, General Electric, and Caterpillar. That should tell you who stands to benefit from this trade agreement, and it isn’t going to be U.S. workers. This is just another chapter in the book of destructive trade policy that has led to America’s chronic decline.
Regardless who is in office, these criminally destructive policies will continue as one would expect with any fascist nation. Although the definition of fascism is not clearly agreed upon by many authorities, I use the definition embraced by Benito Mussolini, which attributes fascism as a partnership between government and corporations. This is similar to corporatism, a political system whereby legislative authority is provided to corporate bodies representing economic, industrial and professional groups. Rather than the people, these corporate bodies dictate the laws of the nation.
This is precisely what we see in the U.S., with CEOs of the Fortune 50 wielding more power than any senator or congressman. Corporations exert their control over Washington via huge sums of money shuttled to politicians by lobbyists. Moreover, the corporate giants provide Washington with often illegal if not unconstitutional access to the nation’s backbone, whether it is in the telecommunications, railway and air transport, or banking sectors. In return for these favors, Washington permits these corporate giants to engage in monopolistic expansions, thereby destroying small businesses, in order to eliminate competition so that they gain complete control over pricing of their goods and services. [22] [23] [24] [25]
After seeing how the real America works, it would be easy to enter the perma-bear camp. But as we have seen, adapting such a mentality would be destructive to your investment portfolio. For instance, the perma-bears and gold bugs who have been selling doom for decades. As a result, those who followed this static and extremist guidance missed out on the great bull market period in U.S. history. More recently, the same camp has been warning their followers of a further stock market collapse since May of 2009 because they are fixated on doom and have no ability to navigate the ups and downs. Those who listen to individuals who have financial agendas to remain bearish will never make any money. Only those with the agendas will make money.
Despite my understanding of the economic picture and overall pessimistic long-term outlook for the U.S. economy, I have kept my newsletter subscribers in the stock market for about 90% of the time ever since advising investors to start buying into the stock market in early March 2009, right when the lows were reached. I rode the stock market all the way up from the lows because I understand it’s not as simple as looking at data and investing accordingly. The process of transforming what you know into investment gains is extremely complex. Anytime you see the obvious, you’re likely to make the wrong move.
In contrast, all of these perpetual bears have caused their audience to miss out on the largest stock market rally since the Great Depression.
At least one newsletter publisher (who has been plastered throughout the Internet and broadcast media as an expert) even advised their subscribers to short the market by 200% in late 2009! [26]
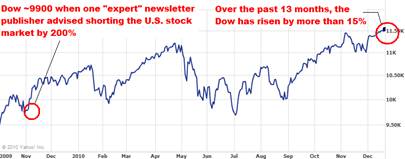
You can be spot on with an economic analysis and still lose a tremendous amount of money in the stock market. The key is to understand when to shift gears. Understanding the risks to the economy only helps you protect your downside. But if you focus on the risks without reading how investors are reacting to their perceptions of reality, you will miss tremendous opportunities.
The reason why the perma-bear crowd is unable to beat the long-term performance of the Dow Jones and Nasdaq is the same reason why the perma-bulls like mutual fund managers fail to do so; they only know one direction. While the perma-bears are always predicting doom, fund managers believe in perpetual economic prosperity. [27]
If you want to make money in the stock market over the next several years, you better know when to shift gears. You better know when to get in and when to get out. You better know how to forecast major stock market movements. The events over the past few years have demonstrated this. The buy-and-hold strategy officially died in 2001, and I don’t expect it to return for many, many years, if ever.
The difficulty in understanding market strength and direction is that it is often uncorrelated in time with economic strength. This is primarily due to differing perceptions held by investors.
In Part 3, I will discuss GDP data, inflation, and the Fed’s latest round of quantitative easing. I will also provide some very important conclusions as to what is happening globally, and what to expect down the road.
I invite you to join other subscribers who wish to become great investors, as they learn how to navigate the financial landmines that promise to be commonplace for years to come. The best way to achieve this difficult task is to subscribe to the AVA Investment Analytics newsletter. There is simply no other investment newsletter like it in the world. www.avaresearch.com


By Mike Stathis
www.avaresearch.com
Copyright © 2010. All Rights Reserved. Mike Stathis.
Mike Stathis is the Managing Principal of Apex Venture Advisors , a business and investment intelligence firm serving the needs of venture firms, corporations and hedge funds on a variety of projects. Mike's work in the private markets includes valuation analysis, deal structuring, and business strategy. In the public markets he has assisted hedge funds with investment strategy, valuation analysis, market forecasting, risk management, and distressed securities analysis. Prior to Apex Advisors, Mike worked at UBS and Bear Stearns, focusing on asset management and merchant banking.
The accuracy of his predictions and insights detailed in the 2006 release of America's Financial Apocalypse and Cashing in on the Real Estate Bubble have positioned him as one of America's most insightful and creative financial minds. These books serve as proof that he remains well ahead of the curve, as he continues to position his clients with a unique competitive advantage. His first book, The Startup Company Bible for Entrepreneurs has become required reading for high-tech entrepreneurs, and is used in several business schools as a required text for completion of the MBA program.
READ THIS LEGAL NOTIFICATION IF YOU INTEND TO REPUBLISH ANY PORTION OF THIS MATERIAL
Market Oracle has received permission rights to publish this article. Any republications of this article or any others by AVA Investment Analytics must be approved by authorized staff at AVA Investment Analytics. Failure to do so could result in legal actions due to copyright infringement.
Our attorneys have determined that the so-called “Fair Use” exemption as it applies to the Digital Millennium Copyright Act does not permit use by websites that have ads or any other commercial application.
In addition, fair use does not imply articles can be republished or reproduced. The distinction between fair use and infringement may be unclear and not easily defined. There is no specific number of words, lines, or notes that may safely be taken without permission. Acknowledging the source of the copyrighted material does not substitute for obtaining permission. Please see this statement from the U.S. Copyright office for more information. http://www.copyright.gov/fls/fl102.html
Requests to the Publisher for permission or further information should be sent to info@apexva.com
Books Published
"America's Financial Apocalypse" (Condensed Version) http://www.amazon.com/...
"Cashing in on the Real Estate Bubble" http://www.amazon.com/...
"The Startup Company Bible for Entrepreneurs" http://www.amazon.com...
Disclaimer: All investment commentaries and recommendations herein have been presented for educational purposes, are generic and not meant to serve as individual investment advice, and should not be taken as such. Readers should consult their registered financial representative to determine the suitability of all investment strategies discussed. Without a consideration of each investor's financial profile. The investment strategies herein do not apply to 401(k), IRA or any other tax-deferred retirement accounts due to the limitations of these investment vehicles.
© 2005-2022 http://www.MarketOracle.co.uk - The Market Oracle is a FREE Daily Financial Markets Analysis & Forecasting online publication.


