Outlook 2011, Five Stocks Due For a Pullback (CAT, AMZN, NFLX, X, BIDU)
Companies / Company Chart Analysis Dec 27, 2010 - 01:37 AM GMTBy: Dian_L_Chu
 It is inevitable that when you have a market run up like we have had recently driven mostly by liquidity and the Santa Claus Rally, many stocks would see pullbacks in the New Year.
The following are just five of such candidates that I believe capable of some meaningful downside risk, and are not intended to be all inclusive.
Could This CAT Bounce?
Caterpillar (CAT) stock has had an enormous run and has finished the year right at its 52 week high mainly on the emerging markets and global resources/commodities trade. A very well run corporation, but there are a couple of challenges for 2011.
First of all, everybody and their uncle are already in this stock. Second, the 31 P/E Ratio for a Farm & Construction Machinery company seems a little rich when compared to an Apple for example, with a P/E Ratio of 21, and they are a tech firm which usually carry higher P/E Ratios.
Third, China, a major market for CAT, is battling an escalating inflation problem, and I expect Beijing to undergo a severe tightening during the first half of 2011, with at least three interest rate raises during 2011. Last but not least, due to global inflation pressures, CAT`s input costs are going to go up, which puts a squeeze on margins.
Look for a significant pullback to the $84 level where it should find some initial support, with the 80 level being much stronger support. If CAT breaks the $80 level this should be a warning sign for investors to re-evaluate the reasons for this technical breakdown. Is it a general stock market decline, or something company specific like a bad earnings report with poor guidance going forward.
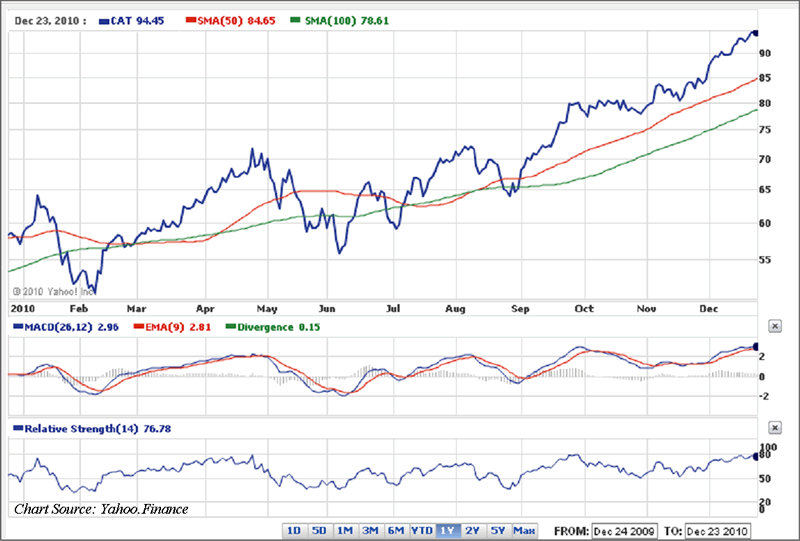
Just remember that any noteworthy negative news regarding the global growth story could affect CAT more than the general market, and specifically, if you see a selloff in the agricultural space due to tightening measures, caterpillar will experience its share of red in market cap.
Amazon (AMZN) – It’s a VaR Jungle Out There
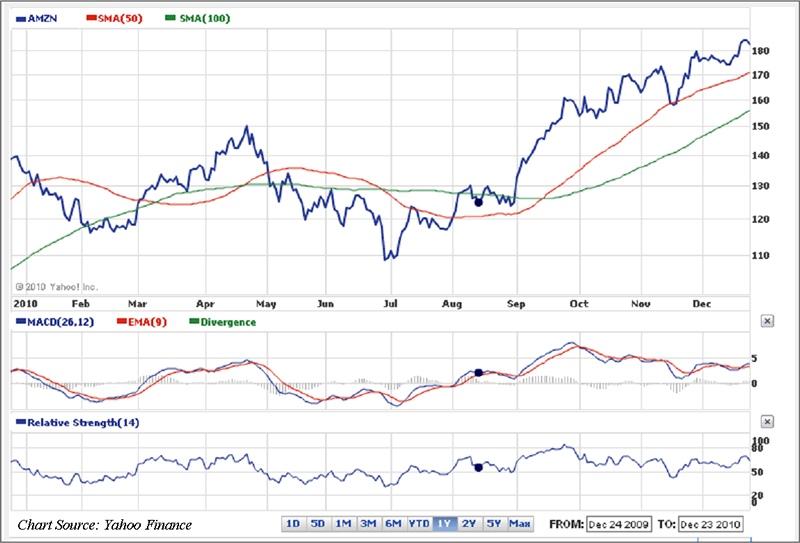
This is another momentum stock from 2010, and talk about high expectations built into this stock as AMZN has a lofty P/E Ratio of 74. Amazon is also finishing the year right at the top of its 52 week high at $182 a share.
I think the best argument for a pullback in this stock is to look what happened last year. Amazon started 2009 at around $54 a share and finished 2009 at approximately $137 a share, a similar stellar liquidity driven year as 2010. Well, the stock pulled back dramatically at the start of 2010 going from the 52 week high area of $137 starting the year to the $116 a share level by February 8th.
Basically a five week decline on pure profit taking after portfolio managers ran the stock up at the end of the preceding year trying to maximize their numbers. I would expect a similar decline for the beginning of this year as well, maybe even some early sellers the last week of the year trying to beat the herd to the exits on this stock.
Expect the pullback to test the $160 area, and if earnings disappoint in late January, expect a sharper correction to the $145 level as short sellers pile in on technical breakdowns pushing stocks lower than they ordinarily would drop on just profit taking alone. That`s the thing you have to remember about Wall Street, stocks usually go a lot lower or higher than you can ever imagine once a directional shift picks up momentum.
On the fundamental side of the equation, Amazon is basically a retail play, and the holiday season is their strongest part of the earnings each year. Once the holidays are over, the stock lacks a catalyst going forward because unlike last year, the company doesn`t have a similar new product like the Kindle offerings to inspire investors. In fact, with a dozen new tablets hitting the market in 2011 in all shapes and sizes, expect much more competition in terms of content providers and device readers.
I’d be very careful with Amazon if you’re long. The stock appears to have little if any immediate upside potential, and is almost a certainty to pullback to $170 faster than you can say “I should have sold when it was $185”. Furthermore, there is much more downside risk when a stock has run up this much.
The obvious strategy now is to take profits, wait for the inevitable pullback, and get back into this stock ideally after the summer doldrums where most techs are week. A good time to buy this stock would be around late July as last year there was a prolonged selloff starting in late April to the start of July where it was around $110 a share.
I would expect a selloff at the beginning of the year. Then buyers would come in and buy the first dip, before the yearly low is put in again during the second selloff of the year around July. There is a reason the old axiom of “Sell in May, and go away” exists in the investing lexicon. The summer often is exemplified by lower VaR (Value at Risk) by the institutional investors, and is historically replete with some of the weaker investment months of the year.
The goal should be to buy the second selloff of the year, and ride the stock straight through the annual Christmas run up through late December.
Netflix (NFLX) – Another AOL?
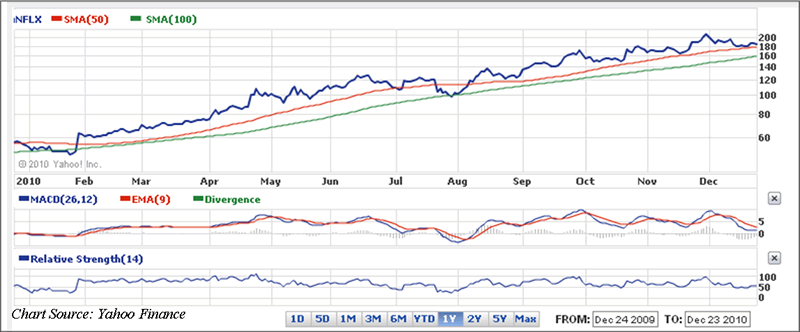
This is a stock that befuddled many shorts in 2010, until it finally had a nice pullback after soaring to $209 a share around December of 2010. However, as stated in my previous analysis, there is more downside ahead for this stock as it is still quite pricy with a P/E Ratio of 70. It was also in a sweet spot in terms of competitors with the bankruptcies of the brick and mortars in the space.
The company was successful enough for others to take notice, but you may expect new product offerings from existing players, and entirely new players altogether in the space for 2011. In short, Netflix`s sweet spot in the space is over.
Technically speaking, expect the pullback to test the $150 level during the first quarter of 2011, and if there is a major earnings disappointment, the $120 level of support is next in line for this stock. If it breaks the $120 area, then chances are this represents a broken stock, and it is best advised to avoid catching the falling knife even on a valuation play. Remember, this stock was a momentum stock, a fad stock, and heavily shorted in 2010.
So far, there seems nothing in Netflix`s business model that cannot in some way be outdone, duplicated, or even refined in a more appealing, efficient product offering by a large competitor with much bigger pockets. So, there will be a new momentum stock in 2011, the shorts will no longer be adding fuel to the fire via successive short squeezes, and all fads come to an end as consumers look towards the next cool thing.
NFLX is another stock with very limited upside and an abundance of downside risk at this point for savvy investors. The question with this stock a la CROX, is not whether this stock pulls back, but more so of how low will it fall, remember CROX`s fall from the $75 area at the peak of its hype all the way to a dollar a share in a year`s time.
The tech sector currently is looking more and more like the tech bubble back in 2000. So, the other intriguing question is whether Netflix would even be around in five years time with the evolutionary changes bound to occur in this space?
It could be Netflix presence in the space might resemble an AOL type of scenario in which after changes in technology made AOL`s business model obsolete-- Could Netflix end up being another AOL?--just hanging around in a reduced state for a decade after their glory days? And AOL was a lot bigger than Netflix back then. It is certainly something to pounder upon.
Bottom line is that investors who are currently in the stock should pick a point where they will get stopped out of this stock if the momentum run is indeed over in 2011.
United States Steel (X) – Better Be A Price Taker at Lower Levels
This is another stock that is ripe for a pullback, and investors should book some profits before the New Year when others are sure to follow suit.
US Steel was $40 a share in late October, and it piggy backed with the rest of equities the last 8 weeks of 2010 where it sits at the $58 share level, all this with a negative earnings per share to its credit. Expect the stock to test the $45 a share level during the first quarter of 2011, probably sooner than later as the last 8 weeks run up just doesn`t have staying power given the fundamentals in the global economy and the steel market.
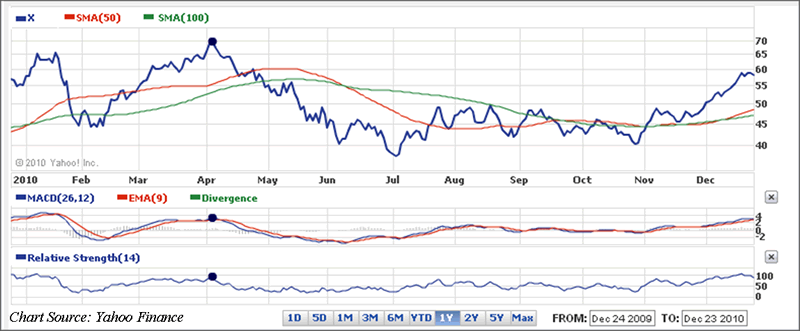
Last year the stock performed this same type of run up into year-end only to pullback significantly in the New Year--in late October of 2009 X went from $35 a share to close out the year near $56 a share in December, it even continued the run for a couple of weeks in January to around the $65 level, only to fall back precipitously to $44 a share by February 8th of 2010.
Expect the same type of pullback in US Steel for 2011 as this is just a trade for money managers, taking advantage of year end momentum to push up stocks and hit their year-end targets. There should be strong support at the $40 a share level for those interested in getting back into this stock on a pullback. However, if it breaks $37 a share, there is something wrong with this company, and that is your max pain threshold.
A good rule of thumb regarding established companies like US Steel from a technical standpoint is to look back at the two year chart of the company (although I only show one-year charts here) , and there are two spikes above the current level, and the stock didn`t stay at those levels very long. In fact, the stock spent much more time trading well below the current levels than above it.
From a logical risk and reward standpoint, do you want to be a buyer or a seller at these levels? For the investor it makes sense to put as much of the odds in your favor, since most investors are price takers, and not price makers, the obvious choice is to be a price taker at a much lower valuation level.
Baidu, Inc. (BIDU) – China Tightening Hurts
BIDU is a high flying tech stock has had quite a run with the highest P/E Ratio in the group at an astounding 83. Part of the rationale to expect a pullback in this stock is that China is going to have a tough time of things for the first half of 2011 while they are in super tightening mode.
Beijing hiked interest rates 25 basis points on the 25th of December, and I expect 3 more rate increases during the first half of the year as they try to tackle an ever present inflation problem in their economy. As the Chinese market pulls back, so will the US market, but especially stocks that are closely tied to the Chinese market such as Bidu.
As we speak, the stock is around $100 a share, and expect a significant pullback to the $80 a share level during the first quarter of 2011. The next major area of support is around the $70 a share level. If it breaks $70 a share, some serious questions need to be answered before getting back in on this stock like “Is China`s bubble bursting?” or “Is there a new direct competitor in China?” etc. as this is a technical breakdown of the stock.
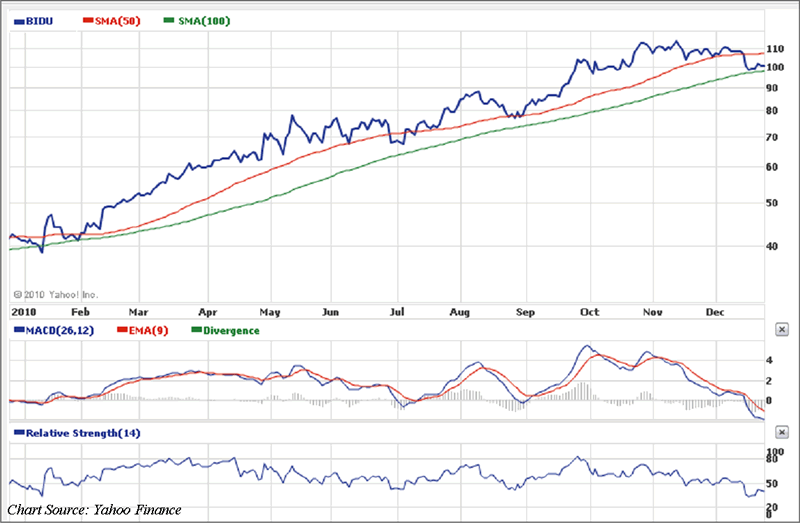
From a technical standpoint Bidu has already started to show signs of putting in a near-term top, as the rest of the market was exploding higher, up 6.5% so far in December, BIDU was actually on the downswing from the $110 high established December 6th. The reason is that China was pulling back on tightening concerns. Well, every week there is some kind of new tightening measure coming out of China, and this is what is pulling Bidu down, in my opinion.
So now that China has started pulling out the big guns in terms of tightening with interest rate hikes, expect Bidu and the Chinese market to pull back even further. Throw in a long overdue US equities pullback into the equation, and you get the picture--it is not unreasonable for Bidu to test the $80 a share level in the next six weeks.
But when you have a down trending stock like BIDU in an otherwise robust market, it seems to be sending signals that there is more weakness to come. The idea is that if it is weak now, it should be even weaker when the entire market starts to pull back in early 2011.
Goal - Not Be The Last Standing
The one thing we have learned during the last decade is that the buy and hold strategy for the most part is dead, it has been a trader`s market, and the smart money isn`t going to wait for an engraved invitation to sell at these levels. Avoid being the last person standing looking for the musical chair.
Meanwhile, I would be interested in some of the other candidates that readers think fit the bill as well for potential pullback targets.
Disclosure: No Postions
Dian L. Chu, M.B.A., C.P.M. and Chartered Economist, is a market analyst and financial writer regularly contributing to Seeking Alpha, Zero Hedge, and other major investment websites. Ms. Chu has been syndicated to Reuters, USA Today, NPR, and BusinessWeek. She blogs at Economic Forecasts & Opinions.
© 2010 Copyright Dian L. Chu - All Rights Reserved Disclaimer: The above is a matter of opinion provided for general information purposes only and is not intended as investment advice. Information and analysis above are derived from sources and utilising methods believed to be reliable, but we cannot accept responsibility for any losses you may incur as a result of this analysis. Individuals should consult with their personal financial advisors.
© 2005-2022 http://www.MarketOracle.co.uk - The Market Oracle is a FREE Daily Financial Markets Analysis & Forecasting online publication.


