Lower Interest Rates and the Relative Performance of Investments - Part 3 of 4
InvestorEducation / Learning to Invest Oct 22, 2007 - 01:02 AM GMTBy: Chris_Ciovacco
 To recap the main points :
- Wall Street places a strong emphasis on the impact of the Fed’s actions on asset prices.
- Lower interest rates help fuel inflation and hurt the U.S. dollar.
- The current Fed is not afraid to make significant interest rate cuts and we can expect them to act swiftly in the face of any continued deterioration in housing, financial markets, or the general economy.
The Housing Market is Dragging Down the Economy – Time to Get Defensive, Right?
While there are many valid reasons to be concerned about the outlook for housing, asset markets, and the U.S. economy, we have to balance our concerns with the possible Fed reaction to any further weakness, which would most likely be additional interest rate cuts. You may think this is a good time to be ultra conservative as an investor, but history and the Fed’s track record are cause for striking a proper risk-reward balance based on what really matters in the long run, which is the preservation of purchasing power.The assets to avoid or underweight in an inflationary environment are the more conservative fixed investment options such as money markets, CDs, and bonds (debt).
When you hold a fixed investment, you really do not own anything tangible; you have simply made a loan to another party which agrees to repay you, usually at a fixed rate. In a simple example, if annual price inflation is running at 10% per year, which was not uncommon in the 1970’s, and you are earning 5% in CDs, your purchasing power is actually declining by 5% per year. It is unfortunate, but the current state of the economic landscape and monetary policy penalizes both prudent savers and conservative investors via the destruction of their hard-earned purchasing power. Endless credit creation forces all investors to take on more risk if they hope to outrun the Fed’s money printers.
A Prudent, Diversified, and Balanced Approach is Needed
My last update, Stock Market Behavior Following Fed Rate Cuts , examined three previous Fed rate-reduction cycles which occurred in similar economic environments to the one we have today. The results may have concerned some clients and loyal readers since it appeared to have a bullish bias. I am in no way considering or advocating any investor become overly aggressive with their allocation to stocks (especially U.S. stocks) given the current set of economic uncertainties.
The analysis was done to simply gain some insight into the risk appetite of investors in the year following the first rate cut in a new Fed cycle. The results mesh well with my comments above in that investors did invest in stocks (a risk asset) following the first cut, at least in part to hedge against inflation. A significant part of successful investing is understanding how others most likely will react to current and expected market conditions. The cold, hard facts are the market does not care what we think as individuals.
We can benefit from understanding how others will most likely react to the current set of circumstances given how they have reacted to similar circumstances in the past.
Since there are an infinite number of variables which affect the relative performance of various investments, it is helpful to attempt to quantify the relative importance of some of the major variables such as inflation, the strength of the U.S. dollar vs. other currencies, GDP, unemployment, housing, interest rates (Fed Funds), and recent stock market performance. Our last update made a case the rate cutting cycles which began in July 1986, July 1995, September 1998, and January 2001, represented the best historical comparisons to the present day. In this update, I’ll expand on the concept of similarity to past events and include the performance of multiple asset classes vs. just exploring the performance of the S&P 500 after the first rate cut. Since I have previously collected daily historical data for multiple assets classes going back to January 1, 1995, I eliminated the rate cutting cycle which began in July 1986.
Determining How to Weight Different Factors and Different Historical Periods
With respect and understanding of the much warranted fear of further deterioration in the value of the U.S. dollar (a crash is called for by some), I decided to explore the relative importance of the U.S. dollar to stock prices vs. other major economic factors. The correlation between various economic factors and stock prices during the period 1995-2006 is shown in Table 1. The respective correlation to stock prices is relevant since stocks influence the risk appetite for all asset classes. The relative importance shown in the last column of Table 1 simply takes the absolute value of each correlation and scales them all to 100%.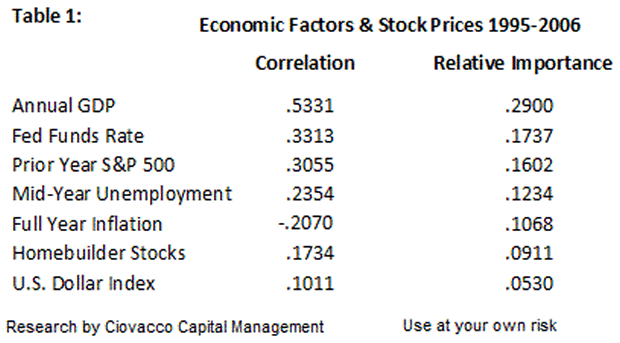
Based on historical data from 1995-2006, GDP (or the strength of the economy) has been the most important factor influencing stock prices. The strength of the U.S. dollar was the least important. That finding may surprise many who have well founded concerns about the dollar’s possible impact on asset prices. I think there are two logical explanations for the dollar’s seemingly low relative importance. As mentioned above, monetary inflation or the expansion of the money supply is a global phenomenon.
This in no way diminishes the importance of protecting against a falling dollar.
If anything, it reinforces the importance since most major currencies, albeit at different rates, are being debased. Said another way, you may be able to lower the pace of loss of purchasing power by owning assets denominated in other currencies, but that alone may not protect you. The best protection on a global basis is via the ownership of tangible assets. It is not a stretch to say the real currencies in our world are tangibles like gold and crude oil since they are traded and priced globally based on supply and demand. Unlike paper or electronic money, it is also difficult in the short-to-intermediate term to vastly increase the supply of gold or crude oil.
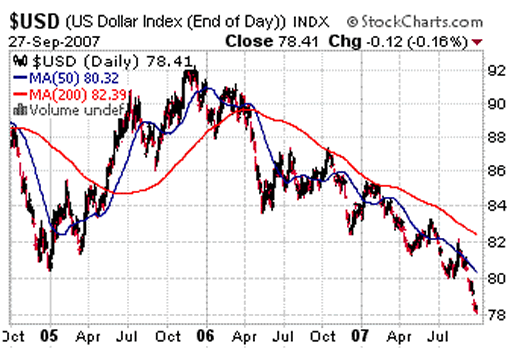
The dollar’s possible negative impact on all U.S. asset prices, including stocks and bonds, would become much more relevant in the event of a disorderly decline vs. other currencies. Up to this point, the dollar has been hit hard, but has declined at a less than crisis-headline rate. The recent drop below 80 (see chart below) was significant and may signal a shift in global investors’ desire to hold dollars or more importantly dollar denominated assets (U.S. stocks, bonds, real estate). The chart is courtesy of www.stockcharts.com.
Next, we will take a look at how similar today’s economic landscape is to the previous periods of Fed rates cuts based on the economic factors shown in Tables 2-A and 2-B. To do this, I simply looked at the variance between the values of each economic factor today vs. past values. As an example, the published unemployment rate on September 18, 2007 (the day the Fed cut rates) was 4.60%. The published unemployment rate on July 6, 1995 (the day the Fed first cut rates in that cycle) was 5.30%. The variance between the two numbers is 15.21% (5.30% is 15.21% higher than 4.60%). Scaling all the variances to add to 100% produces a relative similarity between unemployment in 1995, 1998, 2001 and 2007. The economic data from each period of rate cuts is shown in Table 2-A and 2-B. The results of the similarity calculations are shown in Table 3.
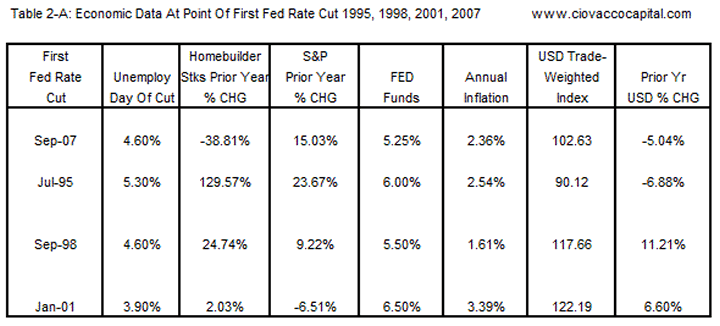
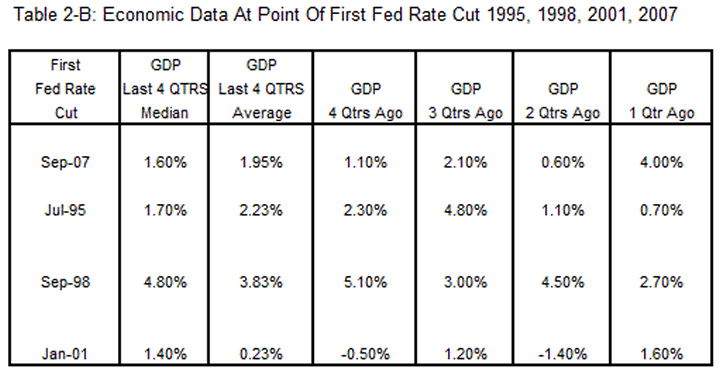
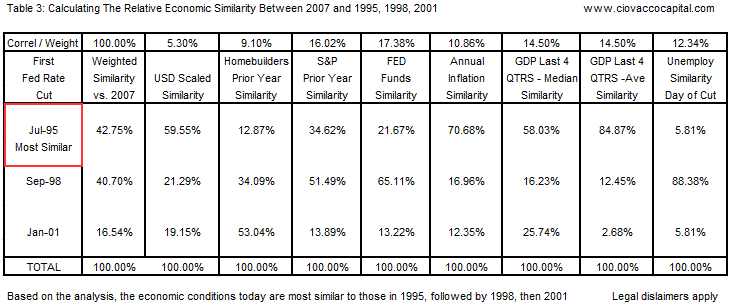
Based on the economic factors in Tables 2-A and 2-B (unemployment, the prior year performance of homebuilders’ stocks, the prior year performance of the S&P 500, the Fed Funds rate prior to the firstcut, the published annual inflation rate, the value of the trade-weighted U.S. dollar index, the prior year percent change in the trade-weighted U.S. dollar index, and GDP figures for the four quarters preceding the first Fed rate cut) , the economic conditions in September 2007 are most similar to those in July of 1995, closely followed by those in September 1998.
On a relative basis, January of 2001 is not nearly as similar to today vs. 1995 and 1998. Said another way, based on the economic factors listed above, there is a 42.75% chance the next year will look most like the period from July 1995 to July of 1996, there is a 40.70% chance the next year will look most like the period from September 1998 to September of 1999, and there is a 16.54% chance that next year will look similar to the period from January 2001 to January 2002.
Chris Ciovacco
Ciovacco Capital Management
Copyright (C) 2007 Ciovacco Capital Management, LLC All Rights Reserved.
Chris Ciovacco is the Chief Investment Officer for Ciovacco Capital Management, LLC. More on the web at www.ciovaccocapital.com
Ciovacco Capital Management, LLC is an independent money management firm based in Atlanta, Georgia. As a registered investment advisor, CCM helps individual investors, large & small; achieve improved investment results via independent research and globally diversified investment portfolios. Since we are a fee-based firm, our only objective is to help you protect and grow your assets. Our long-term, theme-oriented, buy-and-hold approach allows for portfolio rebalancing from time to time to adjust to new opportunities or changing market conditions. When looking at money managers in Atlanta, take a hard look at CCM.
All material presented herein is believed to be reliable but we cannot attest to its accuracy. Investment recommendations may change and readers are urged to check with their investment counselors and tax advisors before making any investment decisions. Opinions expressed in these reports may change without prior notice. This memorandum is based on information available to the public. No representation is made that it is accurate or complete. This memorandum is not an offer to buy or sell or a solicitation of an offer to buy or sell the securities mentioned. The investments discussed or recommended in this report may be unsuitable for investors depending on their specific investment objectives and financial position. Past performance is not necessarily a guide to future performance. The price or value of the investments to which this report relates, either directly or indirectly, may fall or rise against the interest of investors. All prices and yields contained in this report are subject to change without notice. This information is based on hypothetical assumptions and is intended for illustrative purposes only. THERE ARE NO WARRANTIES, EXPRESSED OR IMPLIED, AS TO ACCURACY, COMPLETENESS, OR RESULTS OBTAINED FROM ANY INFORMATION CONTAINED IN THIS ARTICLE. PAST PERFORMANCE DOES NOT GUARANTEE FUTURE RESULTS.
Chris Ciovacco Archive |
© 2005-2022 http://www.MarketOracle.co.uk - The Market Oracle is a FREE Daily Financial Markets Analysis & Forecasting online publication.


