


Crude Oil and Gasoline 2011 Forecast
Commodities / Crude Oil Dec 24, 2010 - 08:05 AM GMTBy: Dian_L_Chu

 Just in time for Christmas, On Wednesday, Dec. 22, U.S. gasoline prices hit an average $3 a gallon for the first time in more than two years, according to AAA's Daily Fuel Gauge Report. Meanwhile, U.S. stocks and oil also climbed to the highest levels since 2008.
Crude = 71% of Gasoline Price
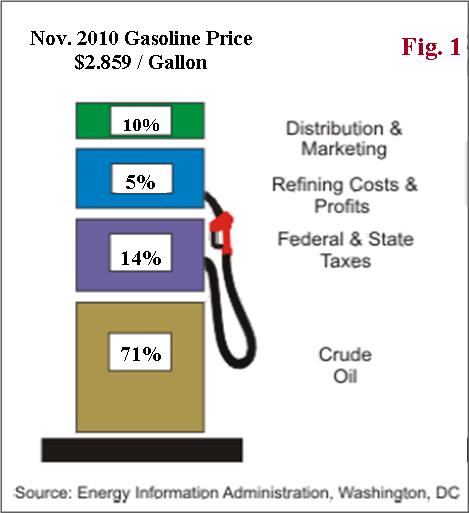 Crude oil is the biggest component, and accounts for about 71% of the price of gasoline as of Nov. 2010, based on EIA estimate (Fig. 1). Roughly, for every one dollar increase in the per barrel (42 gallons) price of oil, gasoline prices rise 2.5 cents per gallon. So, a ten-dollar rise in crude price per barrel would add about 25 cents at the pump.
Crude Prices Defy Ample Supplies
This new gasoline high came just as crude oil also reached a two-year high as traders bid it up after U.S. Energy Dept. reported a week-on-week inventory draw, while unusually cold weather in the United States and Europe has also helped.
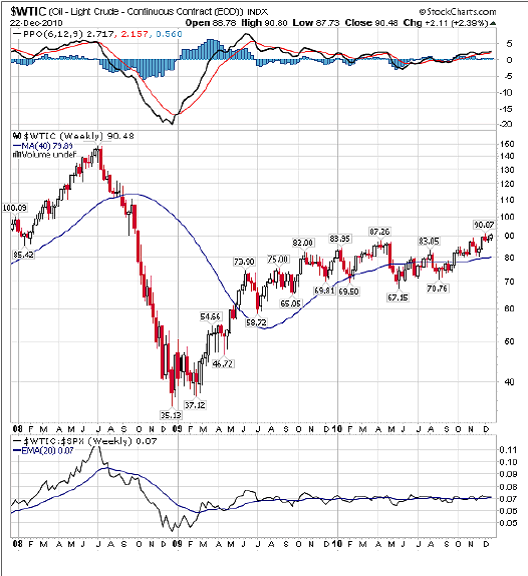
Oil futures for February delivery rose to $90.48 a barrel, the highest since Oct. 3, 2008. Prices have climbed 14% this year, and up about 26% since late August. And by the way crude oil prices are climbing; you’d think there’s a supply shortage. Totally not so:
- The week-on-week crude inventory draw was largely due to refiners’ year-end strategy to minimize potential taxes on year-end inventory.
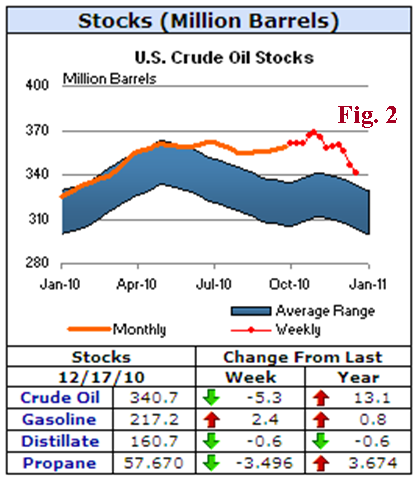
- Despite a weekly draw, crude oil, along with products inventories (except distillate), all saw a year-over-year increase (Fig. 2). Crude inventory level is still above the average range (Fig. 2), while gasoline inventory is also close to the high end of the average range.
- If there’s strong demand elsewhere around the globe, as many have suggested, there should not be such a build in the domestic inventory.
- The global physical oil market also tells a similar story. WSJ reported that the International Energy Agency (IEA) estimates OPEC spare capacity is around 6.4% of global demand, nearly double the level of late 2007. Data from Oil Market Intelligence also indicate the world oil inventories stood at 20 days worth of demand, up from 14 days in November 2007.
Gasoline Prices Defy Historical Pattern
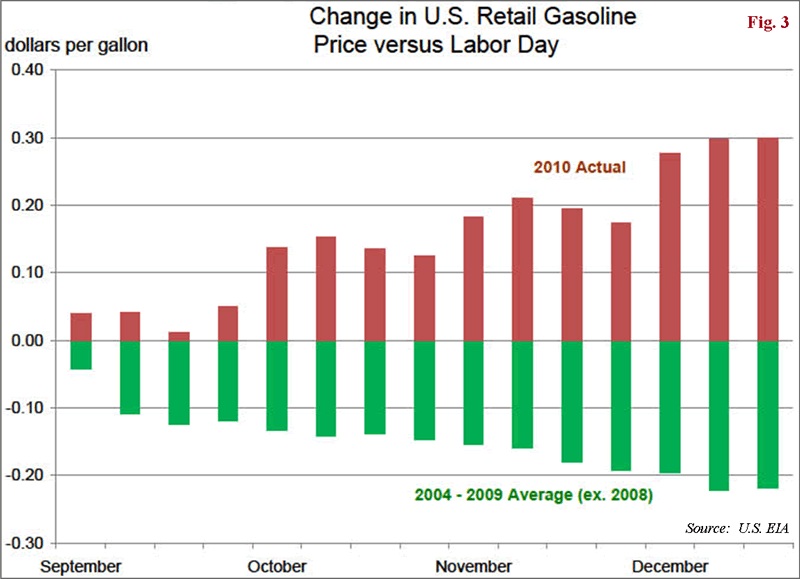
Moreover, gasoline also saw some unusual movement. Gasoline prices in the U.S. generally follow a seasonal pattern – prices typically rise during summer driving season and drop after Labor Day. However, the EIA reported that there’s a reversal of pattern this year - the national average price has risen by 30 cents per gallon since Labor Day (Fig. 3), the largest increase over that period since 1990.
Blinded by Santa
Meanwhile, many analysts, including the EIA, attributed the run-up in crude prices and the reversal of historical pattern in gasoline prices to strengthening global product demand and firming economic growth in the U.S.
However, people seem to have been blinded by Santa as to the obvious:
An above $3 a gallon gasoline price during the third week of December was last seen in 2007-- one year prior to the financial crisis.
The last time, any time during the year, the national average for regular unleaded was above $3 was in 2008, when crude reached an all-time high of $147 a barrel!
Bear in mind, the unemployment rate was 4.6% and 5.8% in 2007 and 2008 respectively when gasoline was above $3 a gallon, and there was actually a global supply crunch due to robust (pre-crisis) global growth.
What’s Wrong with This Picture?
In contrast, here we are in 2010, barely out of the Great Recession, the jobless rate is hovering around 10%--twice the levels in 2007/08--while the housing sector remains under intensive care with existing home sales down 27.9% year-over-year in Nov.
So, it begs the question-- what’s wrong with this picture? How could crude oil and gasoline be at this price level given ample supplies, and a lack luster macroeconomic condition?
QE Liquidity Euphoria
As discussed before, one thing the U.S. Fed’s QE has accomplished is building up concerns about the possible inflation. Expectation of inflation, improving global growth, and increasing risk appetite because of the U.S. Federal Reserve's QE pumping up the economy, have driven investors to plow money into the commodities and stocks at a record pace.
This massive QE liquidity is also a major factor in the current strong correlation between WTI crude and S&P 500--another reversal of historical pattern. So, it is no coincidence that the S&P 500 index also hit its highest level since the collapse of Lehman Brothers.
The broader equity and commodity markets, including crude oil, are artificially supported by the U.S. Federal Reserve, and largely detached from the market demand and supply factors, where traders/speculators will run the show at least through 2011.
More Downside Possibilities
Most agencies forecast the world oil demand to outstrip supply in the long run; however, during next year, there could be a lot more downside possibilities than upside surprises. Some of crude oil’s downside possibilities in 2011 could come from one or a combination of the following (but not limited to):
- China & India Slowing Growth & Oil Demand - Beijing just slapped a 4% hike on domestic gasoline and diesel prices effective Dec. 22. India is also expected to decide whether to increase state-set fuel prices amid crude oil at near two-year highs. This and other tightening measures to fight inflation would crimp growth as well as oil demand in both countries, the major growth engine of the world.
- High oil prices could trigger a global recessionary cycle - Bank of America Merrill Lynch estimates that a $15 rise in the price of oil could shave about half a percentage point from U.S. economic growth in 2011, enough to wipe out the Fed's QE2 effect.
- A deepening European debt crisis
- Escalating geopolitical tensions in N. Korea, the Middle East, etc.
- U.S. sovereign debt and/or municipal debt crisis
And don’t count on a U.S. recovery to be the upside surprise factor either. The EIA Short-term Energy Outlook published on Dec. 7 projects gasoline consumption in the U.S. to increases by 0.4% and 0.8% in 2010 and 2011 respectively.
$110-$115/bbl by April?
Technically speaking, crude could see some profit taking in January with major support at around $89 levels. Look out below if it breaks resistance of $87. On the upside, the next two key resistance levels should be at $95/b, and $100/b respectively (See Chart)
Nevertheless, if the stars are aligned, that is, global economy really picking up stream with two consecutive months of good U.S. jobs numbers, inflation concerns and QE could form a perfect storm for crude to hit $110 to $115 a barrel late March or April next year, after a few retirements, and if it breaks above $100. At that level, gasoline at the pump could hit $3.70-$3.80 a gallon range.
Escalator Up, Elevator Down
Right now, speculative longs are dominating the crude market with hedge-funds and other large speculators long positions outnumbered short positions by 205,890 contracts in the week to Dec. 14, according to the Commodity Futures Trading Commission (CFTC).
Whenever you have an over-bullish market like this, it sets up for increasing risk and huge swings, particularly for crude oil, as it is one of the most widely traded and speculated asset classes in the world. Liquidity could only drive prices up to a point as there is no real strong demand to support the lofty $100+ crude price levels, but plenty of land mines to spook an exit en masse.
So, expect volatility to be the major theme in the New Year with crude oil taking the escalator up, but the elevator down, and a couple of $12- to- $15 moves in both directions along the way.
Remember, the market is designed to fool most of the people most of the time. ~ Jesse Livermoore
Dian L. Chu, M.B.A., C.P.M. and Chartered Economist, is a market analyst and financial writer regularly contributing to Seeking Alpha, Zero Hedge, and other major investment websites. Ms. Chu has been syndicated to Reuters, USA Today, NPR, and BusinessWeek. She blogs at Economic Forecasts & Opinions.
© 2010 Copyright Dian L. Chu - All Rights Reserved Disclaimer: The above is a matter of opinion provided for general information purposes only and is not intended as investment advice. Information and analysis above are derived from sources and utilising methods believed to be reliable, but we cannot accept responsibility for any losses you may incur as a result of this analysis. Individuals should consult with their personal financial advisors.
© 2005-2022 http://www.MarketOracle.co.uk - The Market Oracle is a FREE Daily Financial Markets Analysis & Forecasting online publication.