


Stock Market Sentiment Not A Barrier To Further Gains
Stock-Markets / Stock Markets 2011 Dec 22, 2010 - 10:08 AM GMTBy: Chris_Ciovacco

 There are currently several reasons to be concerned about the stock market, from debt problems in Europe to slowing technical momentum. However, if investor sentiment is currently at the top of your list of concerns, you may want to bump it down a few notches.
Stock market sentiment relative to a bullish or bearish outlook can be used as a contrary indicator for stock prices when it reaches extremes. If you follow the markets closely, you have run into an article or two making the case that a correction or bear market is imminent based on the current state of extended bullish sentiment.
We, like many familiar with the power of using sentiment, have been concerned in recent weeks. Since the longer-term outlook from a technical and fundamental perspective still appears to support higher stock prices over the coming months, we decided to ask the man who literally wrote the book on stock market analysis. Robert W. Colby, CMT (www.robertwcolby.com), author of The Encyclopedia of Technical Market Analysis, was kind enough to give us his perspective of the current state of the Investors Intelligence Bull/Bear Ratio. Here is what Mr. Colby had to say:
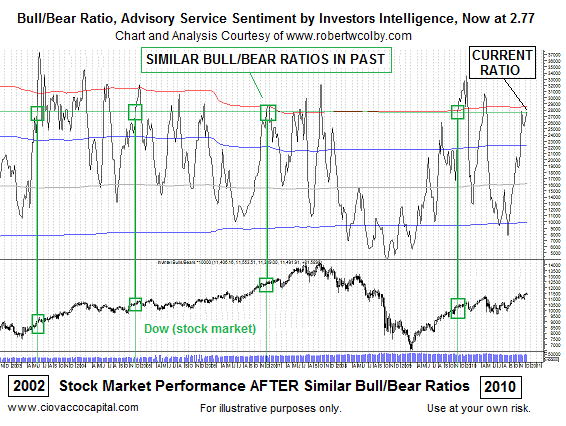
On advisory service sentiment, there were 56.8% bulls versus 20.5% bears as of 12/15/10, according to the weekly Investors Intelligence survey of stock market newsletter advisors. The Bull/Bear ratio stands at 2.77, which is between one and two standard deviations above the long-term, 20-year mean. This is not overly excessive bullish sentiment in the second year of a bull market. Bullish sentiment tends to rise in November and December. The ratio was as high as it is now or higher in Decembers of each year 2003, 2004, 2005, and 2006, and none of these “high” readings led to bear markets. The 20-year range is 0.41 to 3.74, the median is 1.54, and the mean is 1.61.
The VIX Fear Index fell below 8-month lows to 15.46 on 12/17/10, reflecting diminishing fear among options players. VIX is near its 3-year low of 15.23 set on 4/12/10. Before we take the current level of VIX as a sell signal, however, we might consider that VIX was as low as 9.89 on 1/24/07, nearly 10 months before the final tops in the price indexes. VIX is a market estimate of expected constant 30-day volatility, calculated by weighting S&P 500 Index CBOE option bid/ask quotes spanning a wide range of strike prices for the two nearest expiration dates.
Mr. Colby also forwarded a copy of the chart below. We added the green boxes and lines, which show periods where sentiment rose from depressed levels to elevated levels similar to what we have today. The Bull/Bear ratio is shown at the top and the Dow Jones Industrial Average is shown at the bottom. Notice how stocks were able to continue to post gains after the highlighted periods of extended sentiment.
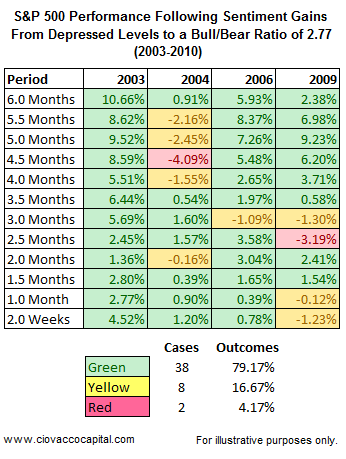
We took Robert W. Colby’s chart (above) and calculated the market’s historical risk-reward profile for the cases highlighted with the green boxes from 2003, 2004, 2006, and 2009. As investors, what we should care about is how the market behaved after similar circumstances in the past. We need to examine the magnitude and frequency of the bullish outcomes relative to the magnitude and frequency of the bearish outcomes to better understand the risk/reward profile of the current market as it relates to sentiment. The table below shows the S&P 500’s performance between two weeks and six months after sentiment rose from very depressed levels to a bull/bear ratio of 2.77. Roughly 80% of the outcomes for stocks were very favorable; roughly 17% were unfavorable (but not enough to warrant selling), and about 4% of the cases resulted in losses on the S&P 500 of 3% or more. That actually looks pretty bullish (lots of green below). The S&P 500 was higher in all four cases six month later.
The second line of the table below (see 5.5 months) shows in the four cases studied (2003, 2004, 2006, and 2009) the S&P 500 posted gains three times (75% of the outcomes) and a loss in one case (25% of the outcomes). The average gain in the three positive cases was 7.99%. The loss, five-and-a-half months after the elevated level of sentiment, in the single negative case for stocks was 2.16%. If history produced wins in 75% of the cases and the average gain was 7.99%, those outcomes compare very favorably to the one case that posted a loss of 2.16%. Hence, the favorable risk-reward ratio of 11.12 shown at the far right of the 5.5 month line.
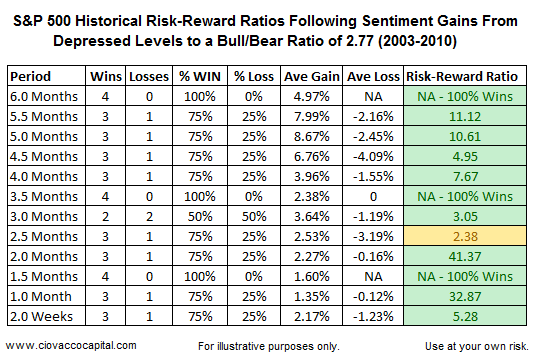
The table above tells us the next two to eight weeks have favorable outlooks from a risk-reward perspective based on sentiment. The outlook for the next 2.5 to 3.0 months is favorable, but somewhat mixed. The picture improves again looking out 3.5 to 6.0 months.
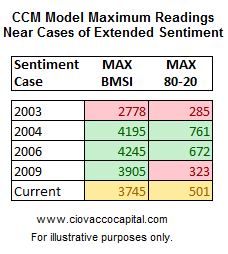
To get another perspective of the big picture, we also looked at the current readings of the CCM Bull Market Sustainability Index (BMSI) and 80-20 Correction Index relative to the periods studied above. The results, shown below, also paint a picture where further gains in stocks, and risk assets, seem within reach.
Ned Davis, of Ned Davis Research, does his homework. From a recent MarketWatch article:
Needless to say, the disturbingly high levels of bullishness that exist today don’t necessarily doom the market. Ned Davis, for one, is giving the rally the benefit of the doubt until it reverses direction, and he is therefore rated moderately bullish.
Even after performing this analysis, we remain concerned about the current state of sentiment. However, we are far less concerned having a better handle on a few historical cases. With numerous concerns in the fundamental and technical realms, we have moved sentiment down the list of reasons to toss and turn at night. As we stated in our 2011 Outlook, we will continue to give the bulls the benefit of the doubt until we see evidence to the contrary.
By Chris Ciovacco
Ciovacco Capital Management
Copyright (C) 2010 Ciovacco Capital Management, LLC All Rights Reserved.
Chris Ciovacco is the Chief Investment Officer for Ciovacco Capital Management, LLC. More on the web at www.ciovaccocapital.com
Ciovacco Capital Management, LLC is an independent money management firm based in Atlanta, Georgia. As a registered investment advisor, CCM helps individual investors, large & small; achieve improved investment results via independent research and globally diversified investment portfolios. Since we are a fee-based firm, our only objective is to help you protect and grow your assets. Our long-term, theme-oriented, buy-and-hold approach allows for portfolio rebalancing from time to time to adjust to new opportunities or changing market conditions. When looking at money managers in Atlanta, take a hard look at CCM.
All material presented herein is believed to be reliable but we cannot attest to its accuracy. Investment recommendations may change and readers are urged to check with their investment counselors and tax advisors before making any investment decisions. Opinions expressed in these reports may change without prior notice. This memorandum is based on information available to the public. No representation is made that it is accurate or complete. This memorandum is not an offer to buy or sell or a solicitation of an offer to buy or sell the securities mentioned. The investments discussed or recommended in this report may be unsuitable for investors depending on their specific investment objectives and financial position. Past performance is not necessarily a guide to future performance. The price or value of the investments to which this report relates, either directly or indirectly, may fall or rise against the interest of investors. All prices and yields contained in this report are subject to change without notice. This information is based on hypothetical assumptions and is intended for illustrative purposes only. THERE ARE NO WARRANTIES, EXPRESSED OR IMPLIED, AS TO ACCURACY, COMPLETENESS, OR RESULTS OBTAINED FROM ANY INFORMATION CONTAINED IN THIS ARTICLE. PAST PERFORMANCE DOES NOT GUARANTEE FUTURE RESULTS.
Chris Ciovacco Archive |
© 2005-2022 http://www.MarketOracle.co.uk - The Market Oracle is a FREE Daily Financial Markets Analysis & Forecasting online publication.