


The Unseen Force in the Stock Market ...
Stock-Markets / Stock Markets 2010 Dec 17, 2010 - 09:37 AM GMTBy: Marty_Chenard

 Sometimes, something is worth repeating ... like this questions from investors:
"Why is it that "negative divergences" aren't triggering, which is rendering various investing models powerless as the market runs over them?"
For years, analyst and market traders have been carefully watching for divergences as a clue to when a trend reversal was going to occur. Many professional investors base their buy/sell strategies on negative and positive divergences. From a technical perspective, many investors used to anticipate break-downs in market support structures when negative divergences started to appear.
To the dismay of these investors, there have been a plethora of negative divergences during the past month ... but, they have just been sitting there dormant ... as the market continued up.
We discussed this topic last week, and it is important enough to readdress it today.
So, what is going on?
The answer is that there is another force in the market that has been overpowering negative divergences. In fact, negative divergences have no power until after this force starts to contract.
What is it?
It is the "net amount of inflowing Liquidity" coming into the market every day. "Net amount of Liquidity" is the amount of Liquidity coming in or leaving the market after all the selling has been absorbed ... or not absorbed.
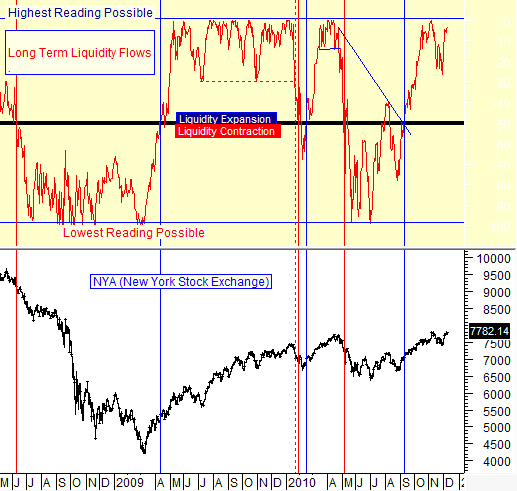
Since September, the net inflowing Liquidity has been in Expansion territory and in an up trend. Inflowing Liquidity is the unseen force in the market that confounds many, and subverts the power of negative divergences as well as many commonly used technical indicators.
It isn't until Liquidity levels pull back in the face of lingering negative divergences, that a market pull back or correction finally occurs. When inflowing Liquidity is in Expansion territory and at a high rate of expansion, the market continues to move up in spite of any negative divergences.
Today's chart is posted everyday in Section 4, charts 8-1 and 8-2 of our paid subscriber site. In respect and fairness to them, this chart will not be posted again for at least another month.
** Feel free to share this page with others by using the "Send this Page to a Friend" link below.
By Marty Chenard
http://www.stocktiming.com/
Please Note: We do not issue Buy or Sell timing recommendations on these Free daily update pages . I hope you understand, that in fairness, our Buy/Sell recommendations and advanced market Models are only available to our paid subscribers on a password required basis. Membership information
Marty Chenard is the Author and Teacher of two Seminar Courses on "Advanced Technical Analysis Investing", Mr. Chenard has been investing for over 30 years. In 2001 when the NASDAQ dropped 24.5%, his personal investment performance for the year was a gain of 57.428%. He is an Advanced Stock Market Technical Analyst that has developed his own proprietary analytical tools. As a result, he was out of the market two weeks before the 1987 Crash in the most recent Bear Market he faxed his Members in March 2000 telling them all to SELL. He is an advanced technical analyst and not an investment advisor, nor a securities broker.
Marty Chenard Archive |
© 2005-2022 http://www.MarketOracle.co.uk - The Market Oracle is a FREE Daily Financial Markets Analysis & Forecasting online publication.