


Gold and the Overall Strength of the Stock Market
Stock-Markets / Stock Markets 2010 Dec 13, 2010 - 03:26 AM GMTBy: Chris_Vermeulen

 The past week has been interesting to say the least. Gold is trying to find support while the SP500 grinds its way higher. Let’s jump into the charts and analysis to get better feel for what I feel is happening here.
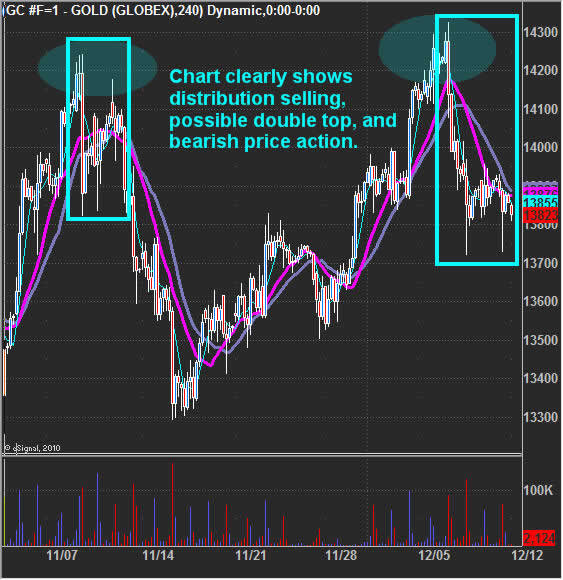
Gold 4 Hour Chart
As you can see from the chart below gold has formed a possible double top. The fact that it made a higher high is actually a bearish sign for the intermediate term 1-3 weeks. When we see a higher high getting sold into with big volume it typically means the big money is unloading large positions into the surge of breakout traders and short covering that occurs when a new high is reached. Following the big money is very important to keep an eye on as it can warn us of possible trend changes before it occurs.
The current selling volume is not exactly a healthy sign if you are looking for higher prices in the near term. If this pattern breaks down I would expect $1340 to be reached very quickly.
Keep in mind gold it in a strong up trend still. Shorting is not the best play in my opinion. I prefer to see pullback which washes the market of weak positions then jump on the long side for another bounce/rally.
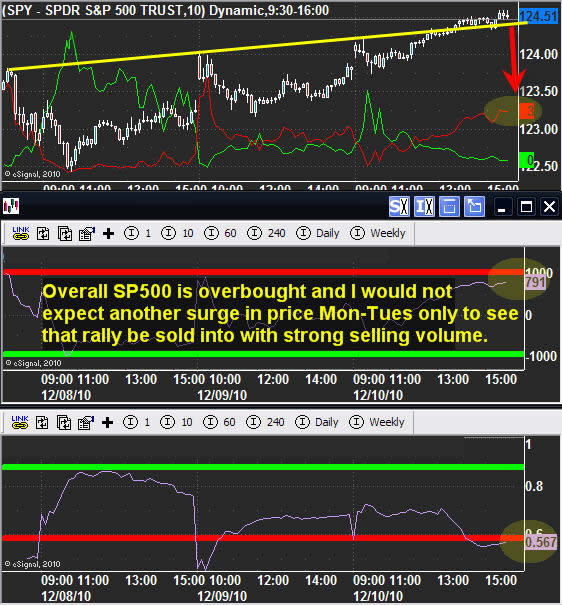
SP500 Market Internal Strength – 10min, 3 days chart
I watch these charts to get a feel for the overall market strength on a short term basis. The top chart shows the SPY etf breaking above a resistance trend line on Friday afternoon. This occurred on light volume meaning it is mostly likely a false breakout and Monday we could see a gap lower at the open or a pop & drop. The two other indicators are reaching an extreme level which normally tells us a pullback is due in the next 24-48 hours of trading. The question is, will us just be a bull market pause or will we get a decent pullback.
The red indicator in the top chart and the red indicator levels on the charts below that help us time the market as to when profits should be taken or to tighten our stops if we have any long positions.
The broad market is still in a very strong uptrend so moving stops up and buying on oversold dips is the way to play it.
Weekend Market Analysis Conclusion:
In short, both gold and the stock market are in a bull market (uptrend). Trying to pick a top to short the market is not a good idea. Instead I am looking for an extreme oversold condition to help reduce downside risk before taking a long position.
The overall strength of the market (SP500 and Gold) I think are starting to weaken but in no way am I going to short them. We continue to buy dips until proven wrong because indicators can stay in the extreme overbought levels for a long period of time. Generally the biggest moves happen in the last 10-20% of the trend.
I’d like you to have my ETF Trade Alerts for Low Risk Setups! Get them here: http://www.thegoldandoilguy.com/specialoffer/signup.html
Also Follow Me on Twitter in Real-Time: http://twitter.com/GoldAndOilGuy
By Chris Vermeulen
Chris@TheGoldAndOilGuy.com
Please visit my website for more information. http://www.TheGoldAndOilGuy.com
Chris Vermeulen is Founder of the popular trading site TheGoldAndOilGuy.com. There he shares his highly successful, low-risk trading method. For 6 years Chris has been a leader in teaching others to skillfully trade in gold, oil, and silver in both bull and bear markets. Subscribers to his service depend on Chris' uniquely consistent investment opportunities that carry exceptionally low risk and high return.
This article is intended solely for information purposes. The opinions are those of the author only. Please conduct further research and consult your financial advisor before making any investment/trading decision. No responsibility can be accepted for losses that may result as a consequence of trading on the basis of this analysis.
Chris Vermeulen Archive |
© 2005-2022 http://www.MarketOracle.co.uk - The Market Oracle is a FREE Daily Financial Markets Analysis & Forecasting online publication.