SPX Stock Market Rally Near Completion, Is the FDIC Out of Cash?
Stock-Markets / Financial Markets 2010 Dec 12, 2010 - 05:31 AM GMT
 November Budget Deficit $150.4 Billion, Worse Than $138 Billion Consensus, Biggest November Deficit On Record
(ZeroHedge) The Treasury has released the November deficit, which at $150.4 billion was about $12 billion worse than expected. Total receipts were $148 billion, of which individual income taxes were $64.3 billion, while the government actually refunded $3.1 billion for corporate taxes in the month. While cumulative receipts since the start of the new fiscal year are better than in the prior year period ($135.7 billion compared to $109.1 billion), it is the expense side that is far more important: in November the government spent $299.4 billion, the bulk of which going to the Department of Health and Human Services ($72 billion), social security ($64 billion), and Defense ($57 billion).
Build America Bonds' End Poised to Batter Muni Market
(Bloomberg) The looming end of the federally subsidized Build America Bonds program may push up yields in the $2.8 trillion municipal securities market and put more financial pressure on cash-strapped states and cities, investors said.
Senate Democrats backing the subsidy, which has helped finance bridges, roads and other public works, fell short in a bid to get the program added to a bill extending the 2001 and 2003 income-tax cuts. That failure was the latest in efforts to keep the Build America program alive beyond its scheduled end on Dec. 31.
VIX revisited the bottom of its Broadening Formation.
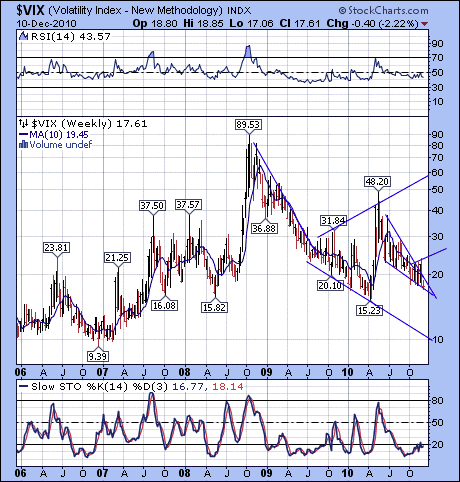 --The VIX revisited the lower trendline of its two month old Broadening Formation a fourth time. This constitutes point 7 of what is normally a 5-point reversal pattern in the smaller formation. Intriguingly, this new low is also point 7 of the larger 16-month long Broadening Formation. It is not unusual to see a smaller fractal within a larger one. This property, known as self-similarity, occurs more commonly than most people think. In both cases the Broadening Formations constitute wave (v) or v of two diagonals or wedges, which are bullish.
.SPX rally may be near completion.
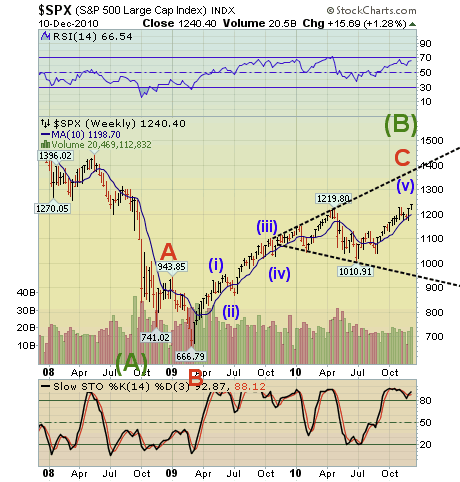 The SPX rallied nearly 16 points higher than last week’s close, ma new high on Friday. By doing so formed either a fifth wave or a triple ziz-zag. Its upper cyclical boundary is 1242-1245.
Regardless of the pattern, there are two EW calculations calling for an end of the rally. The targets are 1242 (hourly)-1246 (daily, weekly). That suggests we may have already seen or are about to see the final high of the Broadening Formation.
This puts us in an ideal position for a repeat of the 6-month decline from May 19 to November 21, 2008 in wave (C).
The NDX does the same.
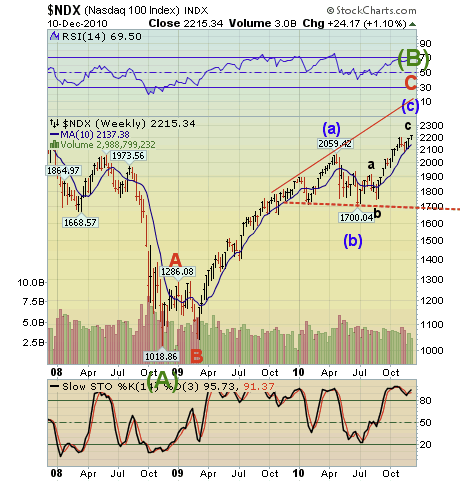 --The NDX also climbed higher off its 10-week moving average. My Model shows that the major indices are pressing hard against their upper Cyclical Boundaries (2203 to 2217). The final wave (c) is a zig-zag, since there are now 5 waves from the August 27 low. This actually adds some clarity to the picture, since the current rally cannot be a 5th wave, based on Elliott Wave Rules. The third wave rule (never the smallest) puts the absolute maximum range for the rally from the March 2009 low at 2089. The extension is corrective, not impulsive. It may have bought more time, but it simply squeezes the next decline into a tighter pattern.
Gold remains above supports.
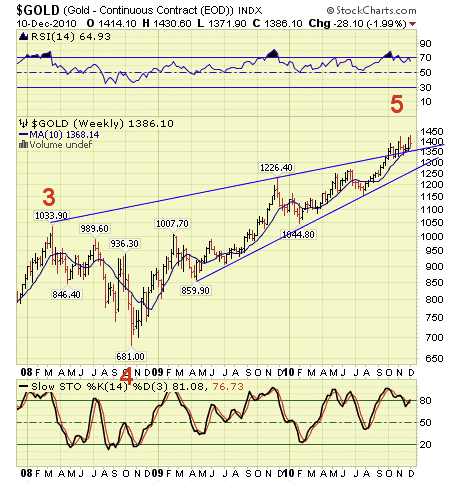 -- Gold also came up against its upper Cyclical Boundary at 1434.26 on Monday before selling off in an impulsive fashion. It appears to have made a small retracement of its decline and may be ready to break below its diagonal pattern. There appears to be a small Broadening Formation (not shown in the weekly chart) that implies a very strong decline to follow.
The message of the Broadening Formation is that, once broken, gold will target the 1035-1080 range.
$WTIC completed a weekly reversal pattern.
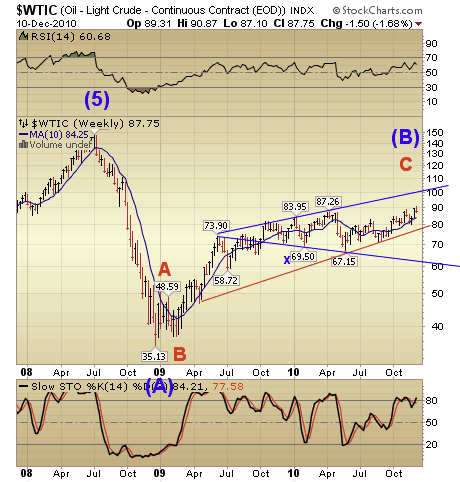 -- $WTIC is also coming against its upper Cyclical Boundary at 89.94 (daily and weekly). It also completed a point 7 in its Broadening
Top formation and a double zig-zag from its May low.
It appears that the zig-zag formations are having two effects. The first is that they are acting as extensions. Bernanke has been visibly providing bail-outs to the markets since the August 2007 low. This has extended and magnified the problem since the bail-outs are nothing more than loans. All the rallies are corrective, not impulsive.
The Bank Index hit its declining trendline.
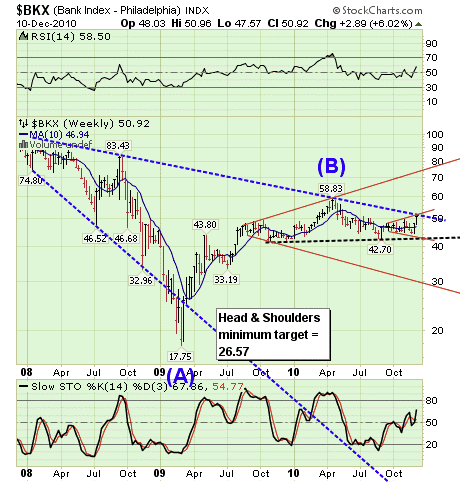 --The $BKX rallied to its declining trendline and formed a probable right shoulder to a massive Head and Shoulders pattern. The Diamond formation appears to be nullified. In this case, the right shoulder of the Head and Shoulders pattern also appears to be yet another Broadening Formation. This should not be considered unusual, since fractals form repeating self-similar patterns.
What is different is that the repetitive corrective patterns are not the type we are used to seeing. What is good about the smaller fractals is that they imply that the larger fractals will soon be breaking down.
The Shanghai Index is below its 10-week moving average.
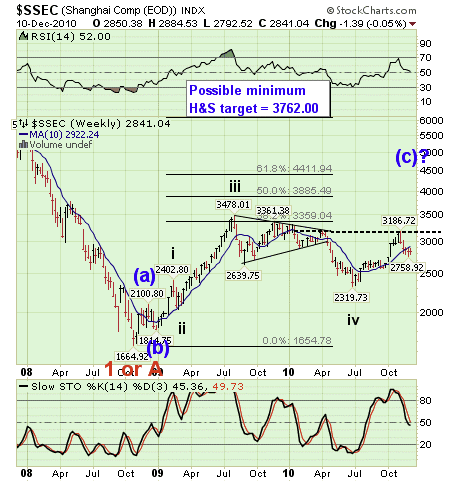 --After testing the 50% retracement at 2753, the Shanghai Index has consolidated in a sideways fashion for the past two weeks. China is under pressure to raise interest rates again. We may not find out until Monday whether they have or not.
The outcome may be an even larger flow of capital into China. Although higher interest rates may not be beneficial to real estate and bonds, the unforeseen result could be a massive rally in equities. I would be bullish once the $SSEC rises above the 10-week moving average.
$USB forms a declining Broadening Wedge.
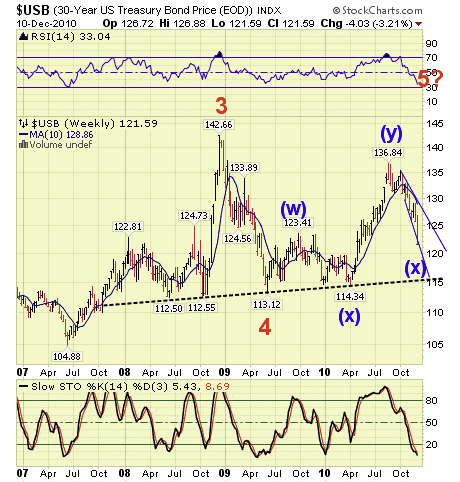 -- $USB extended its decline but adds credibility to the declining Broadening Wedge, which is a continuation formation. We saw a similar pattern in gold in 2008, which
led to a 59% rally in the next two years. The emergence out of this pattern may lead to a very strong rally to 150.00 or possibly higher.
Friday may have been the Pivot Low for the current 8-month cycle. It appears to have made a reversal pattern in the daily chart, so the conditions are ripe for a rally out of the starting gate on Monday.
$USD surged above its 10-week moving average.
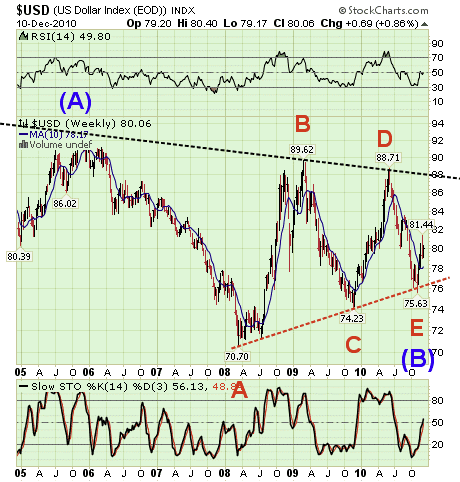 -- The retracement in $USD may be over. Stochastics and RSI both suggest a resumption of the rally may be in order. The larger chart pattern is unmistakably a triangle. That means wave (C) is just beginning. A sharp move out of the triangle should confirm the pattern.
The speculation seems to be that the dollar is rising due to an extension of the Bush tax cuts. With Bernanke now POMO’ing more than $40 billion
per week, I suggest that it may be a flight to liquidity, instead.
Regards,
Tony
Traders alert: The Practical Investor is currently offering the daily Inner Circle Newsletter to new subscribers. Contact us at tpi@thepracticalinvestor.com for a free sample newsletter and subscription information.
Our Investment Advisor Registration is on the Web
We are in the process of updating our website at www.thepracticalinvestor.com to have more information on our services. Log on and click on Advisor Registration to get more details.
If you are a client or wish to become one, please make an appointment to discuss our investment strategies by calling Connie or Tony at (517) 699-1554, ext 10 or 11. Or e-mail us at tpi@thepracticalinvestor.com .
Anthony M. Cherniawski, President and CIO http://www.thepracticalinvestor.com
As a State Registered Investment Advisor, The Practical Investor (TPI) manages private client investment portfolios using a proprietary investment strategy created by Chief Investment Officer Tony Cherniawski. Throughout 2000-01, when many investors felt the pain of double digit market losses, TPI successfully navigated the choppy investment waters, creating a profit for our private investment clients. With a focus on preserving assets and capitalizing on opportunities, TPI clients benefited greatly from the TPI strategies, allowing them to stay on track with their life goals
Disclaimer: The content in this article is written for educational and informational purposes only. There is no offer or recommendation to buy or sell any security and no information contained here should be interpreted or construed as investment advice. Do you own due diligence as the information in this article is the opinion of Anthony M. Cherniawski and subject to change without notice.
Anthony M. Cherniawski Archive |
© 2005-2022 http://www.MarketOracle.co.uk - The Market Oracle is a FREE Daily Financial Markets Analysis & Forecasting online publication.


