


Opposite Trend Paths Forecast For Crude Oil and Gold
Commodities / Commodities Trading Dec 11, 2010 - 04:50 AM GMTBy: Bari_Baig

 This coming weekend’s OPEC meeting is perhaps the quietest of all OPEC meetings we’ve come to know of since we have been trading energy. Absolutely nothing is expected of this meeting and the street too has then no guesstimate wars and everything seems to be rather calm. Few of the members have voiced their opinion that they feel Crude is under speculative control and therefore even if Crude’s price traded $100 per barrel they would not step up to increase the production as no fundamental change has taken place or rightly unless there is no fundamental change. Seems fair enough and we too agree with it.
Now, coming to the more important factor which is the weather and because of which Crude has not taken to a proper corrective phase we’ve be relentlessly saying since the start of this week and also in our article [How high can Crude go and could Gold out do itself]. Europe is under a cold wave and so is the east coast of U.S and when you have a cold spell above normal conditions then you need more fuel to get those boilers running at their optimum capacity. But this cold spell shall soon be broken and with that it breaks Crude into a hard correction.
Another big fact as reported by Bloomberg today was of net increase in Chinese import of Crude oil by 26% in November from October. This apparently seems Bullish for Crude however, as we have stated a few times in last several weeks that markets are nowadays following the classic rule of buy on rumor sell on fact therefore as the “fact” is now disclosed therefore Crude should react negatively and this should further help ease Crude off to low $84 per barrel and to finish this choppy sideways trend as if Crude can somehow get by without a correction.
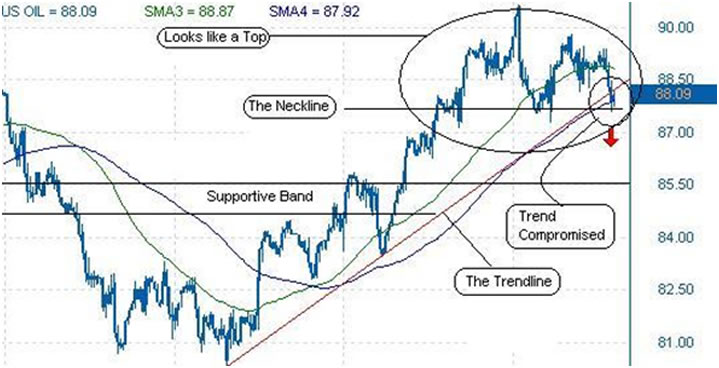
Looking at the chart above which is on a 2 hour timescale we can see the trend line has been compromised and Crude is trading just at the neckline. Break of the neckline would surely add lot more stress on the trend and the supportive band then falls between $84.5 and $85.5 per barrel which is supportive of our view that crude’s correction should push it to the supportive territory. Trade then accordingly.
Now moving to Gold, it was the U.S trade balance for the month of October which narrowed and caused Gold to break the chronic sideways trend from late yesterday and as if that wasn’t enough University of Michigan Confidence Index also came 1.65 over the streets expectation of 72.5 at 74.20 which further pushed the yellow metal what seemed to be the tipping point as Gold inched towards Wednesday’s near low of $1371s. Gold registered a low of $1,372 flat but as we write it is $10 up from the lows. So, that leaves only one question to be asked, did anything change fundamentally after U. Mich confidence index which firstly pushed gold below from $1,382 to the lows and in less than an hour the move reversed? Nothing, absolutely nothing happened! Gold bounced right back up because the “specs” had feared the worst and after surviving the first drop from $1,392 to $1,382 this 2nd leg down was convincing enough to have speculators dump their position and run for the covers. The bounce is taking place because gold became oversold. It was start of this week that Gold posted a high of over $1,430 therefore $60 off from the high price is by any standard a huge discount in one week.
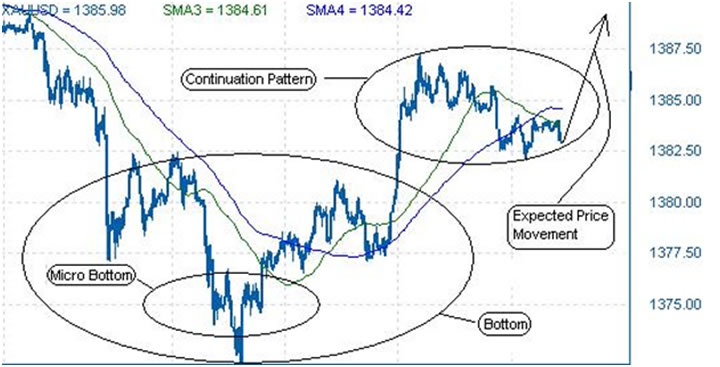
So, what now? Does it end there, is it a mere bounce and gold shall fall right back and break Wednesday lows and start a down trend? No, not at all, certainly Not! To us, Gold shall push further “Today” and try to give a close of over 1388s at the very least if $1392s seems too big of a target. Looking at the chart above we can see two bottoms, one which gold made just over Wednesday low of 1371 which is a micro bottom and then a much larger bottom and currently in a continuation pattern. This chart is of a much smaller time scale but what is important to note is that Wednesday’s bottom was held and gold made a bottom just over that today.
As we repeated stressed last week and especially in our article [How High will Crude go and could Gold out do itself] dated December 6th on www.marketprojection.net that “No, Gold can’t out do itself either. We feel, gold should consolidate and consolidate hard before it moves upward and failure to follow this would not be good”. Gold did just that as it pushed prematurely to post a new high and now Gold bugs are wondering what went wrong. In short and simple, gold got the better of its own success and now that gold has left many of the “bugs” dismayed therefore it shall once again rise and rise smartly and gradually. We see Gold pushing back over $1,405 by mid of next week and again we couldn’t stress enough that unless consolidation doesn’t run its course more whiplashes/violent swings could be around the horizon. We then remain bullish of gold and maintain our topside near term target at $1,470.
So, thus far it has been a good trading day because the ones who didn’t let their emotions take over them and bought at the drop, they are celebrating.
By Bari Baig
http://www.marketprojection.net
© 2010 Copyright Bari Baig - All Rights Reserved
Disclaimer: The above is a matter of opinion provided for general information purposes only and is not intended as investment advice. Information and analysis above are derived from sources and utilising methods believed to be reliable, but we cannot accept responsibility for any losses you may incur as a result of this analysis. Individuals should consult with their personal financial advisors.
© 2005-2022 http://www.MarketOracle.co.uk - The Market Oracle is a FREE Daily Financial Markets Analysis & Forecasting online publication.