China Stocks FXI ETF On Verge of Upside Pivot
Stock-Markets / Chinese Stock Market Dec 08, 2010 - 02:27 AM GMTBy: Mike_Paulenoff
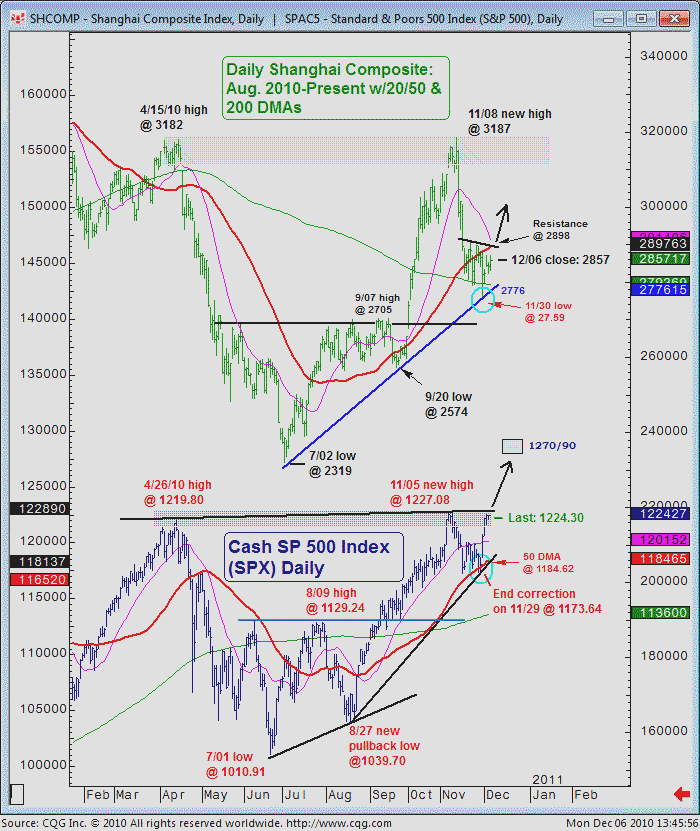
A comparison of the daily charts of the Shanghai Composite, and the S&P 500 shows that each index turned up on November 29-30. The Shanghai turned up after a 50% correction of its July-Nov. advance, and off of its 200 DMA at 2703, while the SPX turned up from its sharply rising 50 DMA after a 30% correction. Both indices are acting very "technical" into year end.
My proxy for the participation in the China equity market (Shanghai Composite) is the iShares FTSE/Xinhua China 25 Index (FXI) for the time being. The technical set-up in the FXI coupled with the very constructive intermediate term chart pattern in the Shanghai Composite argue strongly that the China equity index is on the verge of pivoting to the upside into another powerful upleg off of its July low.
If my work proves accurate, the FXI is emerging out of weakness (from last Thursday's peak at 45.18 to Monday's low at 43.67) and approaching a new upleg that should hurdle 45.18 on the way to the 47.50 vicinity.
Our first chart below shows the index comparison, followed by a chart on the FXI from yesterday that we posted for our subscribers before the start of the up move.

Sign up for a free 15-day trial to Mike's ETF & Stock Trading Diary today.
By Mike Paulenoff
Mike Paulenoff is author of MPTrader.com (www.mptrader.com), a real-time diary of his technical analysis and trading alerts on ETFs covering metals, energy, equity indices, currencies, Treasuries, and specific industries and international regions.
© 2002-2010 MPTrader.com, an AdviceTrade publication. All rights reserved. Any publication, distribution, retransmission or reproduction of information or data contained on this Web site without written consent from MPTrader is prohibited. See our disclaimer.
Mike Paulenoff Archive |
© 2005-2022 http://www.MarketOracle.co.uk - The Market Oracle is a FREE Daily Financial Markets Analysis & Forecasting online publication.


