Recovery Upleg for Cisco Tech Stock
Companies / Company Chart Analysis Dec 07, 2010 - 01:40 AM GMTBy: Mike_Paulenoff
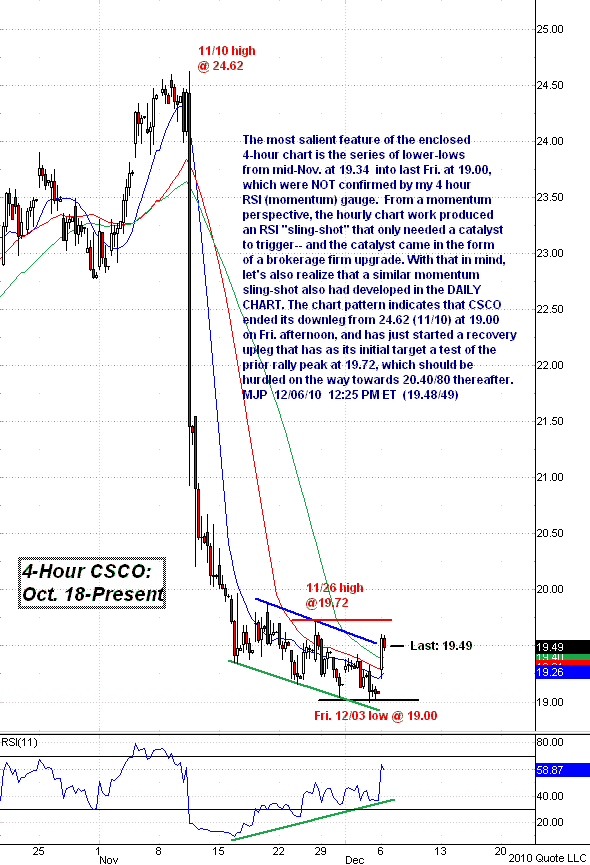
The most salient feature of the enclosed 4-hour chart of Cisco (CSCO) is the series of lower-lows from mid-November at 19.34 into last Friday at 19.00, which were not confirmed by my 4-hour RSI (momentum) gauge.
From a momentum perspective, the hourly chart work produced an RSI "sling-shot" that only needed a catalyst to trigger -- and the catalyst came in the form of a brokerage firm upgrade. With that in mind, let's also realize that a similar momentum sling-shot also had developed in the daily chart. The chart pattern indicates that CSCO ended its downleg from 24.62 (Nov 10) at 19.00 on Friday afternoon, and has just started a recovery upleg.
Initial target is a test of the prior rally peak at 19.72, which should be hurdled on the way towards 20.40/80 thereafter.

Sign up for a free 15-day trial to Mike's ETF & Stock Trading Diary today.
By Mike Paulenoff
Mike Paulenoff is author of MPTrader.com (www.mptrader.com), a real-time diary of his technical analysis and trading alerts on ETFs covering metals, energy, equity indices, currencies, Treasuries, and specific industries and international regions.
© 2002-2010 MPTrader.com, an AdviceTrade publication. All rights reserved. Any publication, distribution, retransmission or reproduction of information or data contained on this Web site without written consent from MPTrader is prohibited. See our disclaimer.
Mike Paulenoff Archive |
© 2005-2022 http://www.MarketOracle.co.uk - The Market Oracle is a FREE Daily Financial Markets Analysis & Forecasting online publication.


