US Treasury Yield Determines Duration Sweet Spot for US Stocks
Stock-Markets / Stock Markets 2010 Dec 07, 2010 - 12:55 AM GMTBy: ECR_Research
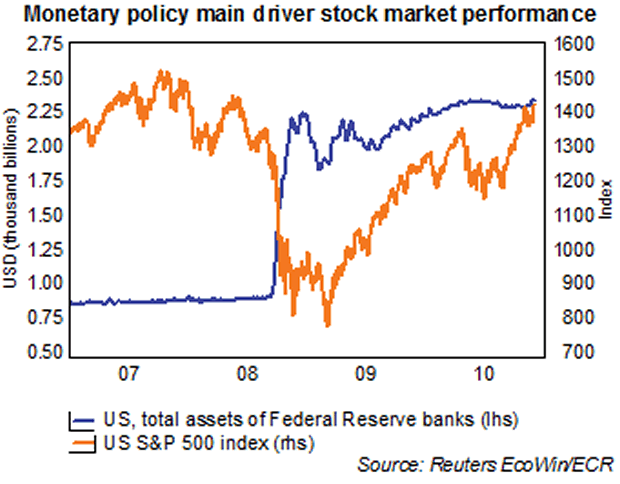
 Over the last quarters, stocks predominantly reacted to monetary policy as is clearly visible in the graph below.
Read the lips of Bernanke and make money. This is nothing new, as an old maxim goes: “Give me the sign of monetary policy (plus for monetary expansion etc.) and I will tell you what the stock markets’ direction will be.”.

The rationale behind this maxim seems to be straightforward. Monetary expansion means lower interest rates, which encourage companies, investors and consumers to save less and to borrow more, in order to invest in productive assets and to buy consumer goods and investment titles.
Fed model
This relationship between interest rates and stock market returns is even formalized in the so-called Fed model. This model captures one of the most popular theories to value equity: the Discounted Cash Flow model (DCF), where expected future dividends are discounted to the present using an appropriate discount factor. Generally, this discount factor consists of the risk free interest rate (usually the 10-yr yield on US Treasuries) plus a mark-up to reflect the company’s risk profile.
To value an index using the DCF method, we have to assume an indefinite stream of dividends plus an appropriate discount rate. This is a daunting task and everyone will use its own expectations regarding future dividends streams and the appropriate discount rate. Therefore, a common method is to use next year earnings expectations (and assume that the growth rate of earnings equals GDP growth) as a proxy for the future stream of dividends and to use the 10-yr UST yield as the discount rate.
The Fed model states that the inverse of the earnings yield (the price/earnings ratio) is inversely correlated to changes in long term Treasury yield. In other words, a decline in long-term interest rates lowers the discount rate at which future earnings are discounted, increasing the present day value of future earnings (and therefore the value of a company or index). Or, to put it more simply, lower interest rates generally leads to higher stock (and other asset) prices. There are of course exceptions, like in 2008 and 2009, when investors sold stocks and fled into Treasuries to shield themselves for a severe recession.
When the central bank takes an already loose monetary policy one step further to quantitative easing, the upward pressure on stocks increases. Over the past couple of years, quantitative easing was (and is) mainly used to fight deflationary pressures stemming from the collapse of an asset price and/or credit bubble. In such a climate, the credit demand destined for investment or consumption purposes is low or the supply of credit is restricted. Therefore, the majority of the ‘printed’ dollars will find its way to the asset markets, rather than to the real economy. Given the important role of monetary policy for the stock markets, a close eye to the monetary outlook is crucial.
Three stages
Generally speaking, there are three stages of stock market performance and monetary policy during and after a recession:
- When it is apparent that the economy is entering a severe slowdown (or recession) and inflation is declining, monetary policy is loosened. Stock prices - after plunging in anticipation of a growth slowdown - start to stabilize, establish a bottom and will correct a major part of the panic-selling-driven plunge that occurred during the final stage of the decline.
- In the second stage, the economy starts to respond to the loose monetary conditions. Investment and consumption are picking up, employment conditions are improving and profits are growing. Generally, this stage is the ‘sweet spot’ for equities, with upward pressure from a loose monetary policy, reinforced by rising profits and earnings expectations.
- In the third stage, the economy is still going strong, but the equity bull market is loosing power. The reason for this is that higher growth rates push up inflation (expectations), and tighter monetary policy and rising interest rates are anticipated. During this stage, the market will form a top and will start to decline.
The difficulty is, of course, to determine in which stage we are. Moreover, there are several circumstances in which an economy or market does not clearly fit in one of the three stages; the market or economy may have characteristics of multiple stages.
However, sometimes it is clear to which stage the stock market belongs. The stock markets of China, Australia, Brazil and India are a good example; they have many characteristics of the final stage, e.g.: strong economic growth, rising inflation expectations and central banks increasing interest rates to cool down inflationary pressures. This does not mean these markets will start to decline right away, but the odds are increasing that the biggest part of the bull market in these countries is behind us.
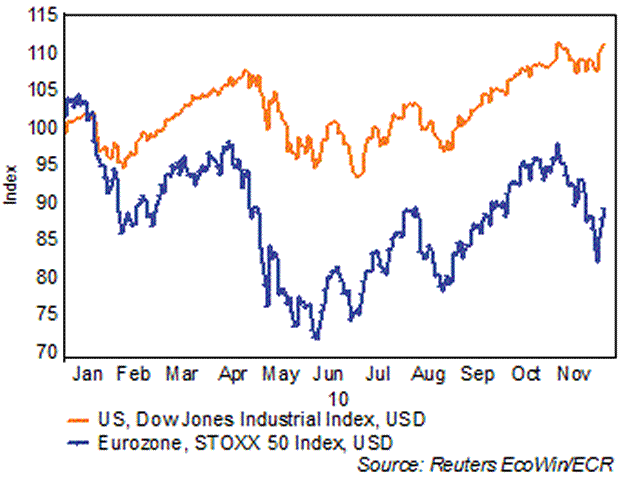
Less clear is the picture for the US and European markets. Both the Fed and the ECB pursue a relatively loose monetary policy, although the Fed is becoming looser while the ECB was, until recently, more inclined to withdraw some of its extraordinary measures, i.e. tighten monetary policy. This is one of the reasons why the European markets have under performed the US markets.

European markets
The sluggish performance of the Eurostoxx 50 hide stark differences between the DAX (which has a lot of characteristics of the second stage) and the indices of Spain, Italy and Greece. These countries are all suffering from a less accommodative stance of the ECB and, moreover, from rising long-term interest rates as a consequence of higher risk premiums. Although these countries do not have the luxury of high economic growth, the odds are increasing that the indices in these countries are in the end of the third stage and have already formed a top. The DAX is performing much stronger, as a result of high growth and capital flows from the financially weaker countries like Spain and Greece, to the German bond market, thereby depressing long-term interest rates.
This discrepancy could continue to grow for a while. Without a currency union, the German Bundesbank would already have tightened monetary policy, which would have brought the DAX in the third stage. However, due to the risk of a double dip in the weaker Eurozone economies, the ECB is under pressure to pursue a much looser monetary policy. This means the equity markets of Spain, and Greece etc. might get some support, but for the DAX this means a sweet spot with a looser monetary policy, inflow of safe haven flows from the weaker economies and high growth. Hence, the DAX might remain in stage two and might have reached its top not yet.
US markets
As noted earlier, after the credit crisis, the Fed pursued a policy of quantitative easing (in the past couple of years, the Fed created more than $1,700 billion dollars extra, until now) to prevent the economy from entering a deflationary spiral). As the US economy stayed surprisingly weak during 2009 and the first half of this year, the stock market entered a sweet spot. Because of the weak economy, inflationary pressure remained low and both the real economy and the real estate market hardly absorbed any extra money. This induced the Fed to continue their exceptionally loose monetary policy and downward pressure on long-term interest rates remained, benefiting mostly the banking sector, plus stock and commodity markets. As a consequence, the US stock market is somewhere in between the first and second stage.
Fortunately, the US economy is recently showing more signs of improvement. This could mean the second stage has just arrived, with several more quarters (or perhaps even years) of improving economic data in combination with rising asset prices. Arguably, with high unemployment and overcapacity, the Fed will be slow to tighten monetary policy. However, this does not necessarily mean the second stage – and the potential for stock prices to rise – will last long. As the economy is improving, more of the dollars created extra will be absorbed by the real economy. Over time, this could well lead to rising inflation. The bond market will ‘smell’ future inflation as well, pushing up real interest rates (as inflation risk premia rise). If the Fed wants to prevent rising real rates, it should end the QE policy and indicate a clear path for when and how the additionally created dollars will be removed from the economy once inflation will increase. However, this means a tighter monetary policy will be followed, which will - over time - push up interest rates and leave less liquidity available for the asset markets. On the other hand, if the Fed stays on the sidelines, real long-term interest rates will likely rise towards 3.5% or higher, which is too high for a housing market which is still vulnerable, and therefore is also too high for the US economy. Hence, both avenues the Fed could take have the ultimate consequence that US stock markets will slow down due to interest rates being too high.
Therefore, the advice is to keep a close eye on long-term US interest rates. The 10-year yield on US Treasuries is already rising on improving data. If this continues, the stock market could rise over the coming months. But do not extrapolate rising stock prices as the economy is improving further. In the short term you are probably right, but history shows monetary policy and the real long-term interest rates are as important as, if not more important than, growth prospects. The million-dollar question is what real long term interest rate proves too much for the stock market. We suspect that, under current conditions, a 10-yr UST yield of 3,5% - 4% is ‘sufficient’ to ignite a sharp downward correction in stock prices in the range of 10% to 20%.
ECR Research (www.ecrresearch.com) is one of Europe’s leading independent macroeconomic research institutes focusing on the main currency and interest rate markets. The ECR reports reach a worldwide audience of sophisticated investors and treasurers and CFO’s within corporations and financial institutions. ECR offers a wide range of research products which are online accessible and updated on a weekly basis.
© 2010 Copyright ECR Research - All Rights Reserved
Disclaimer: The above is a matter of opinion provided for general information purposes only and is not intended as investment advice. Information and analysis above are derived from sources and utilising methods believed to be reliable, but we cannot accept responsibility for any losses you may incur as a result of this analysis. Individuals should consult with their personal financial advisors.
© 2005-2022 http://www.MarketOracle.co.uk - The Market Oracle is a FREE Daily Financial Markets Analysis & Forecasting online publication.


