


Stock Market Heading for Mid to Late December Intermediate Top
Stock-Markets / Stock Markets 2010 Dec 06, 2010 - 04:04 AM GMTBy: Andre_Gratian

Very Long-term trend - The very-long-term cycles are down and if they make their lows when expected, the secular bear market which started in October 2007 should continue until about 2014-2015.
Long-term trend - In March 2009, equity markets began an upward corrective move in the form of a mini bull market. Cycles point to a continuation of this trend into 2011.
SPX: Intermediate trend.Technical observations point to a potential intermediate top in mid to late December
Analysis of the short-term trend is done on a daily basis with the help of hourly charts. It is an important adjunct to the analysis of daily and weekly charts which discusses the course of longer market trends.
Overview:
The SPX is doing exactly what was predicted in the last newsletter. Last week, the equity indices gave a short-term buy signal. This move is the continuation of the intermediate uptrend which started in 7/1 and it is most likely the conclusion of that trend. Those that use Elliott in their analysis believe that it is wave 5 of that move, and they are probably right. If this analysis is correct, it means that the next short-term peak will lead to an intermediate-term correction which should last several weeks and perhaps several months.
Our first task is to evaluate how far this final wave will go. The projection chart of the SPX which follows is a substitute of a Point & Figure chart which I keep by hand and am unable to reproduce. It shows the accumulation pattern which was created prior to the start of the rally and, by breaking it down into separate phases, several potential price projections which can be derived from it.
My favorite target for the end of this move is 1248, and my second choice is 1260. This is based on several considerations: the entire pattern can be divided into two phases. Because this is expected to be the final wave of the move which started in July, the rally is more likely to stop after reaching the projections derived from the first phase of the structure, rather than going for the target provided by the entire base (1312). Even if we take into account only the first phase, it gives us enough of a count for a potential move to 1260. My preference for 1248 is based on the fact that the QQQQ has a pretty well-defined P&F target to about 55 (Friday’s close was 53.88). Based on the current ratio between the two indices, that’s equivalent to about 1250 for the SPX, and 1248 is the closest target to that number.
I should also note that the 55 P&F target for the QQQQ is confirmed by a Fibonacci projection to that level, and that both 1248 and 1260 are Fibonacci targets for the SPX as well. I think that this is enough evidence to make us expect the end of the rally in that price frame. However, should unanticipated superior strength develop, we have the 1312 projection as a backup.
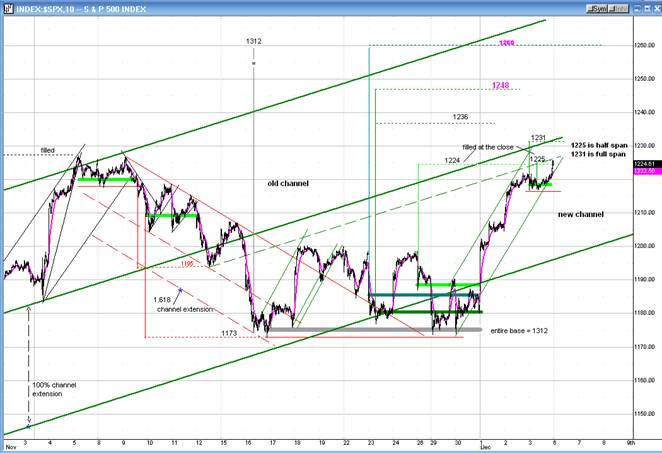
A final note! The smallest phase projection (in light green) gave us a target of 1224. The rally rested at about 1220 and then moved on to 1225 at the close. During this rest period, another small re-accumulation pattern was established consisting of two phases. The first one projected to 1225, and the second to 1231. One of these two levels should be the next resting period for the index on its way to its final destination.
Analysis
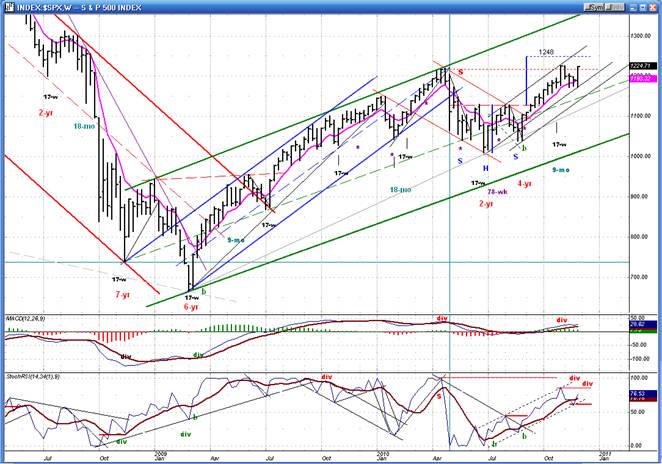
Since I am of the opinion that we are approaching an intermediate top, let’s turn to the Weekly Chart of the SPX to see if we can find some documentation of that possibility.
The chart shows the (blue) intermediate channel for the trend which started at 667 and finished at 1220. It also shows the (green) long-term channel of the bull market which started at the same level in March 2009 and which is still in effect. The 7-yr and 6-yr cycles which caused that low are still in an up-phase, and will not crest, ideally, until 2012, but the long cycles bottoming in 2014 may cause a left-translation with a top in 2011. We should get a confirmation that the bull market is over when the SPX breaks out of the green channel on the downside.
The current trend, which started in July came out of a Head & Shoulder formation. After a three-week correction, the trend resumed last week, and it is already challenging the former recovery highs. But look at the indicators at the bottom of the chart! The MACD is showing mild negative divergence, but the StochRSI, below, is ready to show double negative divergence which is a strong signal that this move is probably coming to an end.
Another interesting by-product of this chart is that the height of the H&S formation, when duplicated from the neckline, gives a projection to 1248 which is another reason to expect that level to be the end of the rally and of the entire trend from July.
We can skip the Daily Chart and move on to the Hourly Chart to see where we are in the current wave -- except to mention that all the daily indicators are showing negative divergence which, unless invalidated by future action, is confirming what we see on the weekly chart.
The uptrend which broke out from the base is delineated with green channel lines. Because of its past record, I had been leery of what effect the 15-wk (73-75 days) high-high cycle might have on the index, looking for the possibility of its driving prices below 1273. But apparently the bottoming 90-day cycle countered the downward pressure nicely and won the tug-of-war.
When we analyzed the projection chart, we saw that the current move had a potential to pause at 1224-25, or possibly, at 1231. If we are coming into a near-term top, it should show up in the hourly indicators; and indeed, they are all showing negative divergence with the top one still overbought. That’s a big red flag. Therefore, our expectation of the move coming to an imminent end is justified. The confirmation of a reversal will come when the index breaks out of its channel on the downside.
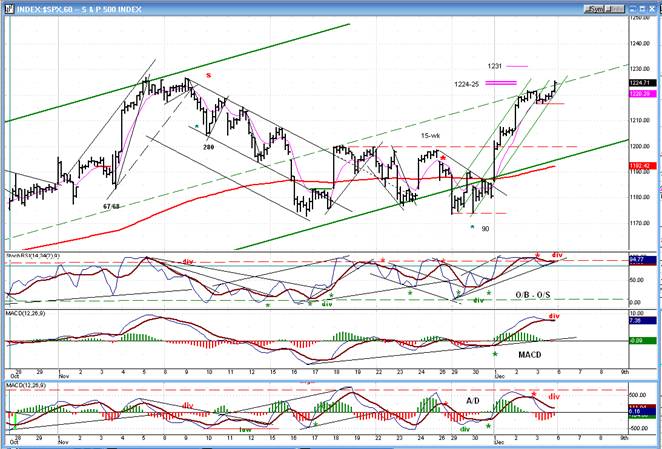
Since we predict the rally to move (ideally) to 1248 in what is likely the final wave of the move, only a near-term consolidation should be expected with a resumption of the uptrend when that is complete.
Cycles
The 15-wk (73-75 days) top to top cycle which had been instrumental in bringing about a decent correction in the past must have been neutralized by the bottoming 90-day cycle because it turned out to be basically a non-event.
The 90-day cycle is behind the push upward. It was due to make its low on 11/29, and this is exactly what happened. The SPX re-tested the 1173 low on that date, moved sideways for a couple of days, and broke out on 12/1.
The next cycle which could influence prices is the 180-day cycle which is due on 1/3/11, followed by a 40-day cycle the following week.
Projections
Look under “Preview” where the projection chart was posted. Most of the evidence points to a high for this move at 1248.
Breadth
The NYSE Summation Index (courtesy of StockCharts) is still in a downtrend in spite of the rally of the last three days. This is a condition which has not been seen since the July low, signaling strong deceleration in the intermediate trend -- another indication that we are coming into an important top.
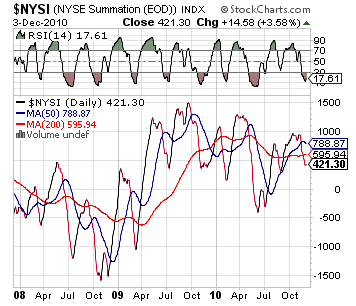
Its RSI is still at a low and will not have time to make much headway if the move stops at 1248.
Sentiment
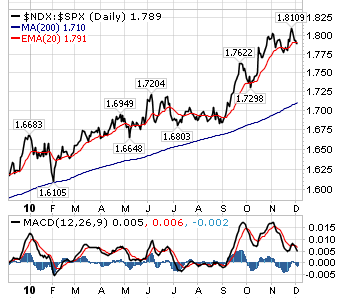
First, I want to show the chart of the relative strength of the NDX to the SPX ( also courtesy of Stock-Charts). I am doing this for two reasons: because it shows that the NDX is becoming relatively weaker than the NDX. This normally precedes a market top and is another red flag. However, the NDX is not exhibiting huge negative weakness relative to the SPX, which tells me that we should not expect the kind of a top which is likely to end the bull market. However, it will probably worsen by the end of the rally, but not enough to warn of a long-term top.
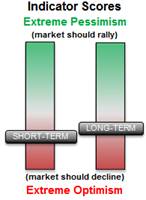
The next chart is that of the SentimenTrader (courtesy of same). Both indicators are in the red. The fact that the short-term is negative attests to the probability of a near-term top. The long-term indicator is not all that negative, but will probably worsen somewhat as the index makes its way to the end of the rally. Even so, unless it gets much deeper into the red, it will not call for a really significant top.
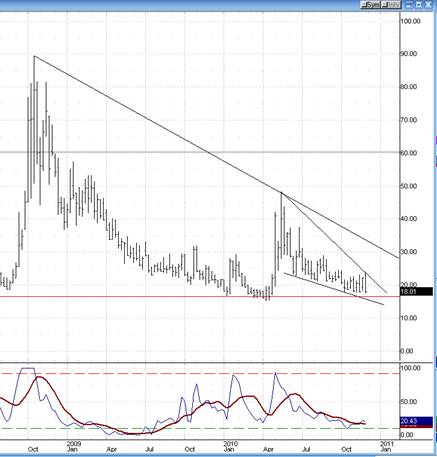
Finally, let’s look at the S&P 500 Volatility Index (VIX). This is a weekly chart which goes back to October 2009. The current reading is approaching the low which was made in April, the last market high prior to the last intermediate downtrend of ten weeks duration.
With this reading, one would have to assume that we are approaching an end to the current rally. If its P&F chart is giving me a valid count, the VIX low should come at 17-17.5. Friday’s low was 17.71.
Dollar index
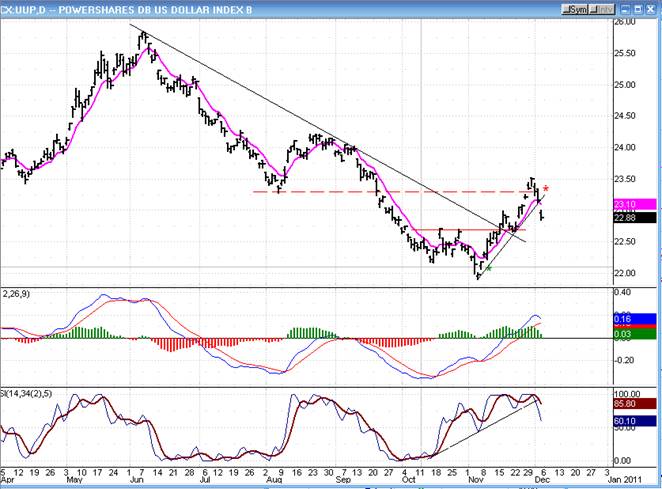
Below is a Daily Chart of the dollar ETF: UUP. Although the inverse correlation between the move of the dollar and equity indices has not always been absolutely perfect in the past, it seems that, since early August, it has. Consequently, it is worth using the dollar as another indicator to anticipate the moves in the SPX.
The dollar filled a downside count to 75 to end a decline from 88+ in early June. The P&F base that it made at 77 allowed for a move to 81-81.50. It reversed at 81.44 four days ago, and started a correction. The indicator will probably require a couple of weeks before being ready to give a buy signal. I don’t have a count for the low, but I guestimate that it will be around 78 (Friday’s close: 79.38). This may be revised when I have more data. The low should coincide with the end of the market rally.
Gold
Since meeting its 139 projection, GLD corrected down to 130 and is now testing the high by trading at 138. If the current P&F configuration can be trusted, this should be the extent of the return move, and the ETF should now continue its consolidation which may turn out to be a distribution area from which a steeper correction can result.
The position of the indicators relative to price show substantial negative divergence, but they have just turned up, and must turn down before the above analysis can be confirmed.
Whatever GLD is currently doing, even if it is building a relatively significant top, it is unlikely that it is
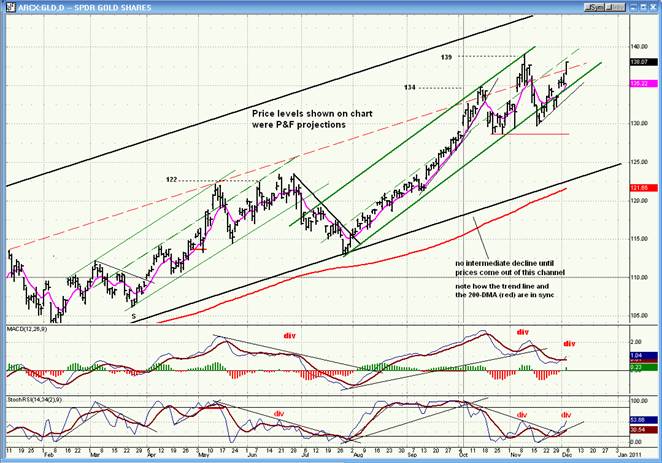
ready to reverse its bullish long-term trend. In order to do this, as is pointed out on the chart, the price
would have to drop below the long-term trend line and its 200-DMA. The most probable scenario, considering that the SPX is apparently near making a high of intermediate proportion, is that GLD -- which has pretty much moved in tandem with it -- will also take more than a short-term breather.
Summary
The SPX – which is essentially representative of all equity indices – appears to be close to making a top of intermediate proportion. This is substantiated by a number of indicators which show patterns typical to a move which is in its very last stages.
The rally which started last week is probably ready for some near-term consolidation. That should be followed by one final push to the preferred 1248 level before reversing.
FREE TRIAL SUBSCRIPTON
If precision in market timing is something which is important to you, you should consider a trial subscription to my service. It is free, and you will have four weeks to evaluate the claims made by the following subscribers:
Thanks for all your help. You have done a superb job in what is obviously a difficult market to gauge. J.D.
Unbelievable call. U nailed it, and never backed off. C.S.
I hope you can teach me about the market and the cycles. I want to be like you and be the best at it. F.J.
But don't take their word for it! Find out for yourself with a FREE 4-week trial. Send an email to ajg@cybertrails.com .
By Andre Gratian
MarketTurningPoints.com
A market advisory service should be evaluated on the basis of its forecasting accuracy and cost. At $25.00 per month, this service is probably the best all-around value. Two areas of analysis that are unmatched anywhere else -- cycles (from 2.5-wk to 18-years and longer) and accurate, coordinated Point & Figure and Fibonacci projections -- are combined with other methodologies to bring you weekly reports and frequent daily updates.
“By the Law of Periodical Repetition, everything which has happened once must happen again, and again, and again -- and not capriciously, but at regular periods, and each thing in its own period, not another’s, and each obeying its own law … The same Nature which delights in periodical repetition in the sky is the Nature which orders the affairs of the earth. Let us not underrate the value of that hint.” -- Mark Twain
You may also want to visit the Market Turning Points website to familiarize yourself with my philosophy and strategy.www.marketurningpoints.com
Disclaimer - The above comments about the financial markets are based purely on what I consider to be sound technical analysis principles uncompromised by fundamental considerations. They represent my own opinion and are not meant to be construed as trading or investment advice, but are offered as an analytical point of view which might be of interest to those who follow stock market cycles and technical analysis.
Andre Gratian Archive |
© 2005-2022 http://www.MarketOracle.co.uk - The Market Oracle is a FREE Daily Financial Markets Analysis & Forecasting online publication.