New Upleg for Newmont Mining (NEM)
Companies / Company Chart Analysis Dec 01, 2010 - 02:34 PM GMTBy: Mike_Paulenoff
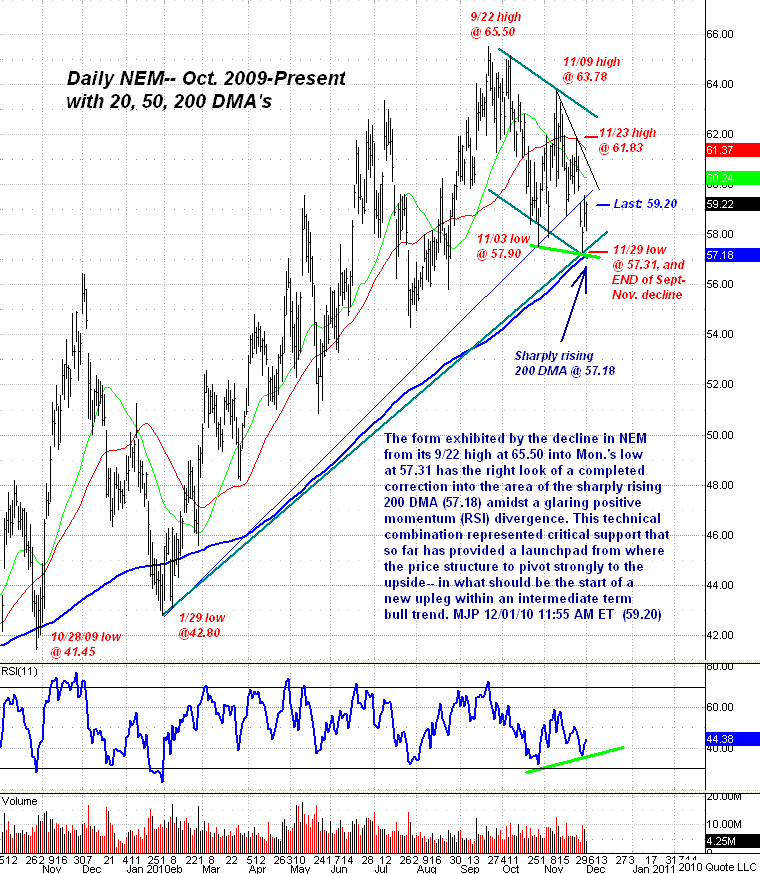
The form exhibited by the decline in Newmont Mining (NYSE: NEM) from its September 22 high at 65.50 into Monday's low at 57.31 has the right look of a completed correction into the area of the sharply rising 200-day moving average (57.18) amidst a glaring positive momentum (RSI) divergence.
This technical combination represents critical support that so far has provided a launch pad from where the price structure can pivot strongly to the upside. As long as last week's low remains intact at 57.31, this should be the start of a new upleg within an intermediate-term bull trend.
Next upside targets: 59.50/60, and then 60.50-61.00.

Sign up for a free 15-day trial to Mike's ETF & Stock Trading Diary today.
By Mike Paulenoff
Mike Paulenoff is author of MPTrader.com (www.mptrader.com), a real-time diary of his technical analysis and trading alerts on ETFs covering metals, energy, equity indices, currencies, Treasuries, and specific industries and international regions.
© 2002-2010 MPTrader.com, an AdviceTrade publication. All rights reserved. Any publication, distribution, retransmission or reproduction of information or data contained on this Web site without written consent from MPTrader is prohibited. See our disclaimer.
Mike Paulenoff Archive |
© 2005-2022 http://www.MarketOracle.co.uk - The Market Oracle is a FREE Daily Financial Markets Analysis & Forecasting online publication.


