


Gold/Platinum Ratio, The Economy And Why You’ll Ask Back Your Gold Card
Commodities / Gold and Silver 2010 Nov 23, 2010 - 06:17 AM GMTBy: Hubert_Moolman

 Most people are mainly concerned with what is going on right now and are less concerned with what happened yesterday, last week or last year. The further in the past an event or development, the less are we concerned about (or aware of) it, and the less is our understanding of it. This appears to be our nature, and it causes many to miss important “big picture” developments.
Here, I would like to discuss one such development and at the same time highlight the outlook for economic conditions over the next few years.
Platinum has been a star performer since the beginning of this century. From about the year 2000 to 2008 it went from just under $400 to a high of $2200. That is an incredible rally, and possibly unrivaled during that period by any other metal or investment class. What is discussed here for platinum holds true for many other assets, even fiat money, but in different aspects, and to various degrees.
Since about the turn of the century, platinum has become the prestige metal. Even credit card companies got into the act by replacing gold cards with platinum cards as their premier credit cards. This, together with platinum’s subsequent rise, ensured that the world became almost platinum crazy.
Even here in South Africa, where we have such an exciting gold history, it became evident that platinum was considered the “new” gold. It appeared that gold took the backseat and platinum enjoyed a new elevated status.
A lot of this fascination with platinum was due to it again becoming more valuable than gold. This platinum mania was indeed justified due to its stellar price performance, especially versus gold. However, it is this very fascination and mania that prevents many from seeing what has been developing over the last 40 years or more, and is now about to conclude (over the remainder of gold’s bull market). Many will be surprised at the impressive gold miner rallies, straight ahead, which will come despite weak general markets.
To understand this development, it is important to understand what the outlook is for the world economy over the next decade. I refer you to my view of the world economy for the next several years.
It is even more important to understand the underlying fundamental cause of this development, since most other factors, like the state of the world economy, are merely symptoms of the “wrong.” This and other articles on my website should help you understand the underlying cause of most of our economic problems.
For most of the last century we have had a corrupt monetary system. This corrupt debt-based monetary system has been suppressing the price of gold for at least the last 80 years. Fiat money and fractional reserve banking are main features of this system, which is the chief underlying cause of most of our economic problems.
This system is now in its 11th hour, and so are all those trends that have come about due to its existence. One such trend is: platinum consistently getting more valuable than gold. There are many more, such as gold and gold mining shares as a percentage of global assets decreasing significantly since at least 1981, having plummeted from 26% of global (investment) assets in 1981 to just 0.8% in 2009, according to Sprott Asset Management.
It is important to note that there will always be such trends, such as increase or decrease between gold and other asset classes; however, under a proper monetary system they will not be as out of balance to the extreme that they are under a debt-based monetary system.
Below is a long-term gold/platinum ratio chart.
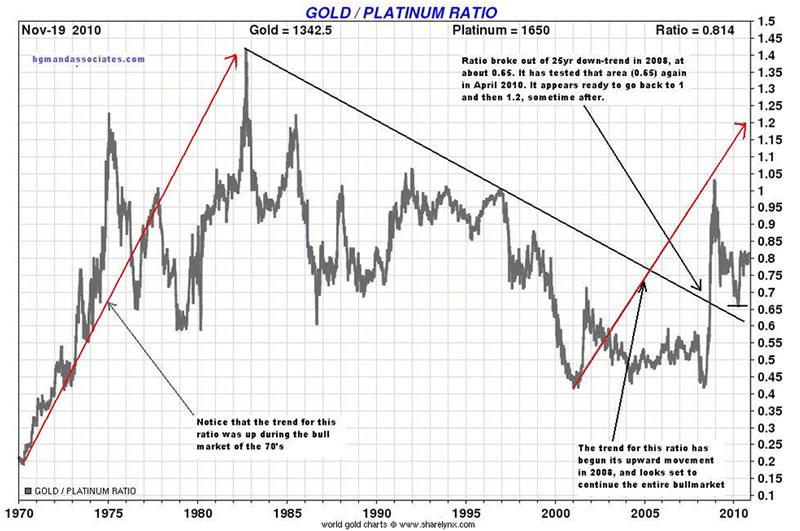
chart comes from sharelynx.com
During the gold bull market of the 1970s, it is clear that this ratio was in a significant uptrend. It went from about 0.2 to 1.4 over a 12 year period. That is a seven-fold increase. I have said it before, the same conditions that propelled gold and other commodities higher during the 70s are present now.
These factors are pushing gold higher now and will continue to do so for many years to come. I certainly expect the gold/platinum ratio to trend higher, just as it did in the 70s. As you can see on the chart, the trend for this ratio has begun moving higher in 2008, and like it did in the 70s, it will accelerate as we move along in this bull market.
The great debt bubble of the last century peaked in 1999, when the Dow/gold ratio peaked. This was the tipping point, which signaled the end of the prosperity that was built by this debt. This was soon confirmed, when gold bottomed, and started an uptrend that continues to accelerate. Likewise, in the middle of the 60s, the Dow/gold ratio peaked, whereafter the link of the dollar to gold was removed and gold started its upward march in the 70s.
We are on a downward economic activity trend, and this should accelerate and continue until debt levels are acceptable for a new economic boom. I believe this will take at least 10 years.
Despite the fact that commodities, like platinum, will outperform most asset classes over the next years, I believe that they will still depreciate significantly as compared to gold (and silver). This is basically what happened during the 70s and is also what happened during the great depression. I have written about the similarities of the great depression, the 70s and today.
Below is a chart that shows the cyclical downturn(s) of industrial production in the US over the last 50 years.
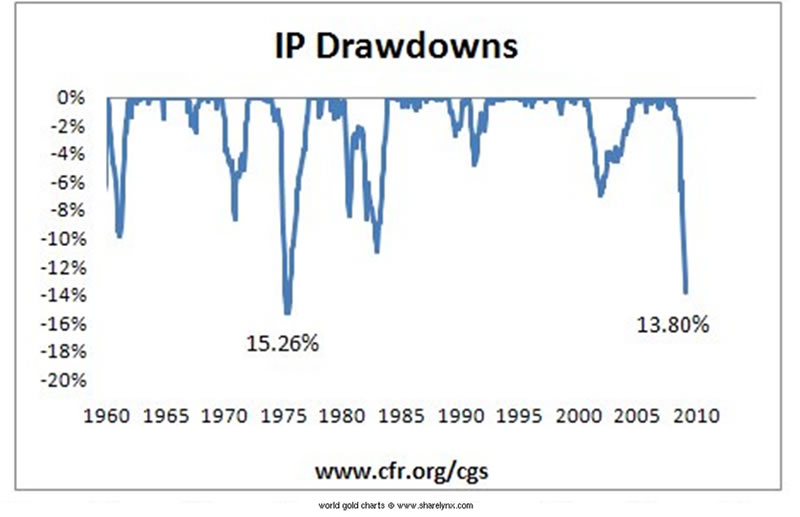
You will notice that during the two parts (70 to 75 and then 76 to 80) of the gold bull market, industrial production turned down significantly. Also, note that the downturn occured towards the end of those gold rallies and, in the case of the second one, continued until after the end of the gold rally.
Back to the long-term gold/platinum ratio chart
On the chart, you will see a 25-year down-trend resistance line, which was broken in 2008. In textbook fashion, the ratio has moved up quickly since then, whereafter it has returned to test the breakout area. A quick move to 1 is expected very soon, and it would go a long way in confirming that the trend in this ratio is unfolding very much like the one of the 70s and is likely to continue throughout this decade.
I believe that the ratio will reach the 1.4 level faster than many would believe (if they believe at all) and that it will go on to reach levels unimaginable for many, because they are unable to comprehend the long-term developments. I just wonder whether banks will revert back to gold credit cards as their premier card. Actually, I wonder if banks will still be around.
Warm regards and God bless--
Hubert
“And it shall come to pass, that whosoever shall call on the name of the Lord shall be saved”
Please visit my blog and website for more of my work and premium service. http://hgmandassociates.com/
You can email any comments to hubert@hgmandassociates.co.za
© 2010 Copyright Hubert Moolman - All Rights Reserved
Disclaimer: The above is a matter of opinion provided for general information purposes only and is not intended as investment advice. Information and analysis above are derived from sources and utilising methods believed to be reliable, but we cannot accept responsibility for any losses you may incur as a result of this analysis. Individuals should consult with their personal financial advisors.
© 2005-2022 http://www.MarketOracle.co.uk - The Market Oracle is a FREE Daily Financial Markets Analysis & Forecasting online publication.