


How HIGH Could Silver Go in December?
Commodities / Gold and Silver 2010 Nov 21, 2010 - 11:21 AM GMTBy: John_Townsend

 There is no other way to describe silver's price movement of the past 13 weeks other than to call it parabolic. With that in mind, I thought it would be interesting to do a little study of past silver parabolic moves and see if I could get a handle on just how high silver could travel into December before it implodes.
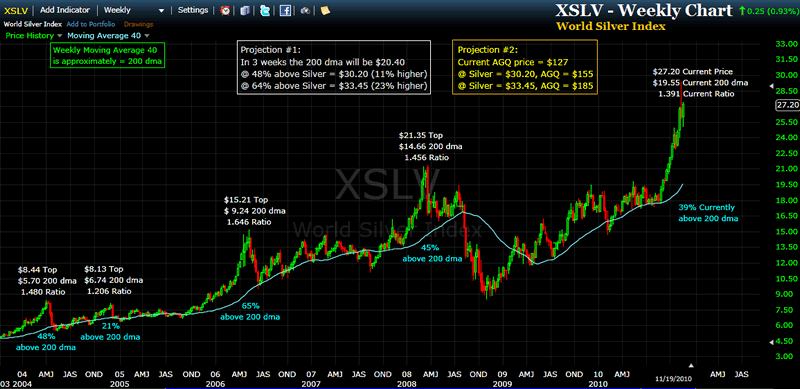
For this study I have chosen to examine the relative degree to which silver price can exceed its underlying 200 day moving average. This weekly chart of the World Silver Index (XSLV) uses the 40 week moving average as a proxy for the 200 day moving average.
Silver is currently making its 5th parabolic appearance since the secular bull market for gold and silver began in late 2001. The range that silver has been able to soar above its 200 dma in previous parabolic moves ranged from a modest 21% to a mind boggling 65%.
The rule of thumb for these kind of things is that the longer the consolidation period preceding the parabolic, the higher the concluding parabolic is likely to rocket. This understanding explains why the parabolic near the end of 2004 achieved only 21% above its 200 dma - as the consolidation period preceding it was a very brief 8 months.
The three other previous silver parabolics had consolidation periods of between 18-24 months. And these three were able to achieve heights exceeding the underlying 200 day moving average by 45%, 48% and 65%.
Our current silver parabolic has had a consolidation period utterly dwarfing all previous specimens - logging in at 33 months. It is conceivable this could be the mother of all parabolics for the current secular bull.
But not allowing myself to get too carried away, my chart offers a projection for silver in the range of the 3 more or less comparable predecessors. i.e. that the current parabolic will achieve a height of 48% to 65% above its 200 dma ($30.20 - $33.45). As silver closed this past week at $27.20, this range projects price higher some 11% - 23%.
If one is invested in Proshares Ultra 2X Silver ETF (AGQ), it is reasonable to double those projected results to amount to a forward gain of between 22% and 46%.
And don't forget, these calculations pretend that the consolidation period of the current parabolic is roughly identical to its predecessors. And it is not. It is nearly TWICE the size.
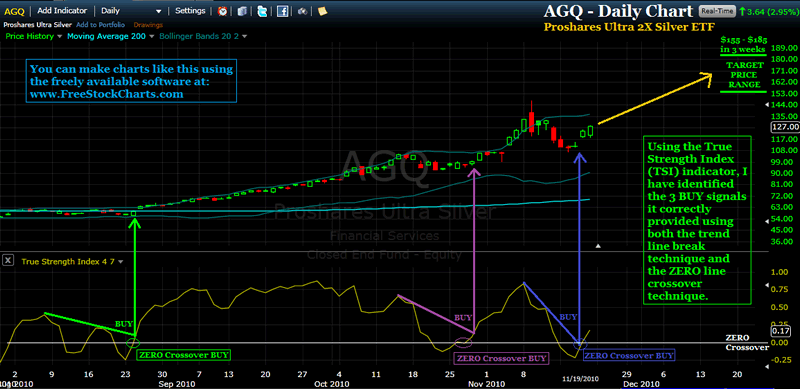
Here I offer a simple chart of Proshares Ultra 2X Silver (AGQ) with my likely modest forecast applied to the chart. I have arbitrarily chosen to guesstimate that this move will last approximately 3 weeks past today.
As gold appears to have begun a new 20-28 day cycle in just the past few days, it would be reasonable to assume that gold may now progress higher for approximately 3-4 weeks. The strongest seasonal price performance for gold occurs in the mid-November to mid-February time frame each year and that time window has just now been swung open. Also, in the past, the top in the daily/weekly cycle of gold has very closely lined up with the top of each silver parabolic move. So, about the time gold tops, so does silver. And unless one believes that gold has already topped, there should be plenty of time left on the shot clock for silver to complete its electrifying mission.
I know to many readers my thoughts may appear to be fantasy. But honestly, I don't know how to better explain what is going on with silver than the way I have.
The other thought I want to share is that while some of us are excited about buying this high momentum run, now is a good time to think about your plan for selling it. I really encourage each participant to think this one through before we get close to the parabolic top. It is infinitely smarter to make a decision based on premeditated rational thinking and then live its consequences, than turn into an emotional basket case and get run over by the freight train when it comes back the other direction.
Wishing you a highly profitable and rewarding month of December!
If you enjoy technical analysis, maybe are curious to learn more about the True Strength Index indicator and how to use it, or just like to be a part of discussion about market and gold price direction, I invite you to visit my website. www.theTSItrader.blogspot.com I provide some useful data on 15 mining stocks with explosive projected earnings, a study of the gold secular bull market beginning in 2001 with charts, and heck, I even post my trading record. Or, you can drop me a line at: tsiTrader@gmail.com Good trading to you,
John Townsend mailto:TSItrader@gmail.com
© 2010 Copyright John Townsend - All Rights Reserved
Disclaimer: The above is a matter of opinion provided for general information purposes only and is not intended as investment advice. Information and analysis above are derived from sources and utilising methods believed to be reliable, but we cannot accept responsibility for any losses you may incur as a result of this analysis. Individuals should consult with their personal financial advisors.
© 2005-2022 http://www.MarketOracle.co.uk - The Market Oracle is a FREE Daily Financial Markets Analysis & Forecasting online publication.
Comments
|
JOHN CAMPONE
22 Nov 10, 06:03 |
SILVER
SILVER IS IN A DEFICIT, AND THE FED'S DO NOT HAVE ANY TO CONTROL PRICES WITH, AS 'THEY' DO WITH GOLD, SILVER IS ON IT'S WAY UP TO THE 100'S, GET READY. |