


How Far Could Stocks Fall? Probabilistic Analysis of the Stock Market’s Downside Risk
Stock-Markets / Stock Markets 2010 Nov 17, 2010 - 10:27 AM GMTBy: Chris_Ciovacco

 With the financial markets facing uncertainty about the balance sheets of banks and governments in Ireland, Spain, and Portugal, continued weakness in stocks, commodities, and precious metals remains a possibility. From a risk management standpoint, it is important for us to understand the possible downside risks in the short-to-intermediate-term. Since risk assets (stocks, commodities, precious metals) have been primarily driven by liquidity, their correlations have been strong since the 2010 summer lows. Therefore, the S&P 500 Index can be used as a proxy for all risk assets. If the downside risks are muted in stocks, they are also somewhat muted in commodities as well.
Due to the following factors, we continue to believe the downside risks in the stock market are manageable in the short-to-intermediate-term:
- Quantitative Easing (QE): The Fed plans to inject freshly printed money into the economy well into 2011, which will place upward pressure on the price of stocks, commodities, and precious metals. While it is beyond the scope of this study, if you are unclear of the potential impact of quantitative easing on asset prices, you can review these QE resources.
- Slow Economic Growth: The calls for a double-dip recession were common in the spring and summer of 2010. An objective review of the data never placed a double-dip as the high probability outcome. We will have to keep an eye on the incoming data, but it continues to support slow, but positive GDP growth. The global economy has numerous problems, but positive growth in global GDP can continue given what we know today (subject to change).
- Technical Support: Buyers and sellers and their trading algorithms tend to have long memories. This study focuses on long and short-term levels of support, trendlines, and Fibonacci retracement levels for the S&P 500 Index. The objective is to better understand where buyers may become interested should further corrective activity unfold in risk assets.
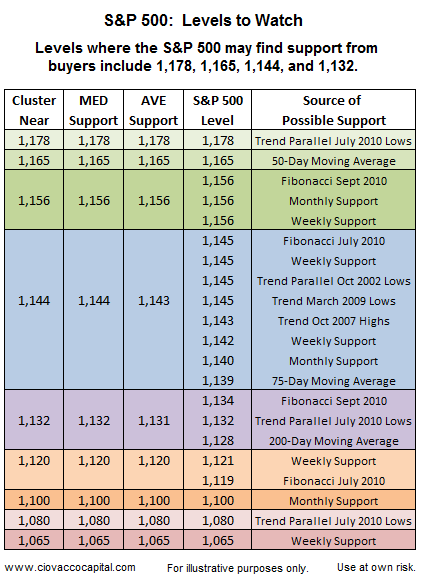
Summary of Results
The table below summarizes the results of the S&P 500 support study. The values on the far left side of the table show where various forms of support for stocks tended to cluster. We would expect some buying interest in the S&P 500 near 1,178, 1,165, 1,156, 1,144, and 1,132. If these levels are breached, then the next areas of support clusters come in near 1,120, 1,100, 1,080, and 1,065. The level where we would expect to see the strongest conviction from buyers comes in near 1,144 on the S&P 500.
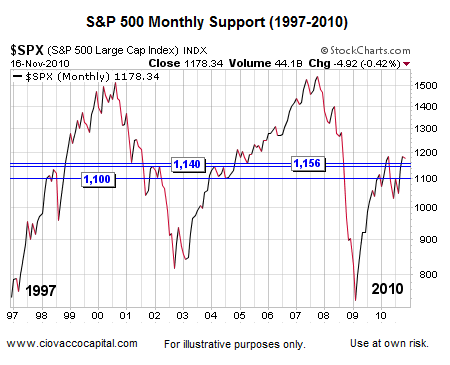
The eight charts of the S&P 500 below show how we compiled the table above. Traders and investors use various tools and examine various timeframes when making allocation decisions. Areas of potential support, or interest from buyers, are more meaningful when they appear in various timeframes and are determined using various methods. Below, we examined areas of past support and resistance on a monthly chart of the S&P 500 going back to 1997. Key levels clustered near 1,156, 1,140, and 1,100.
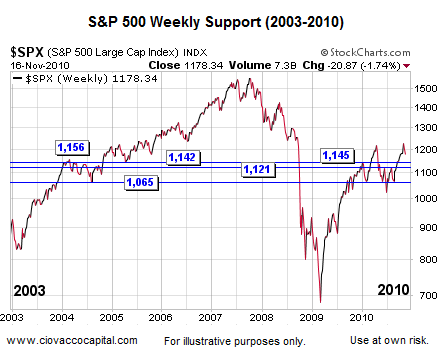
The weekly chart below allows us to look at a little more detail going back to 2003. Key levels tended to cluster near 1,156, 1,145, 1,142, 1,121, and 1,065.
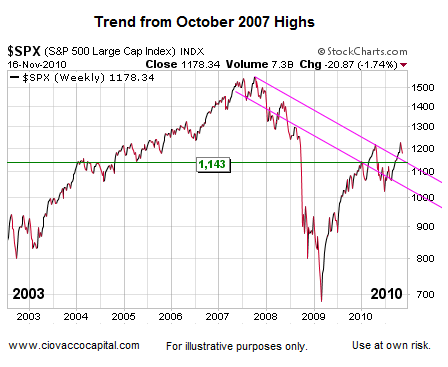
The chart below looks at parallel trend lines on the S&P 500 from the October 2007 highs. If the current day market were to fall further, it may find support from the top pink line near 1,143.
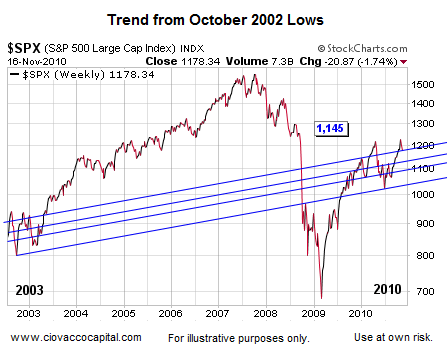
Below, we review parallel trendlines from the October 2002 lows. Notice how markets tend to have long memories relative to parallel trends. Possible support from the top blue line comes in near 1,178; the next line would come into play somewhere near 1,145.
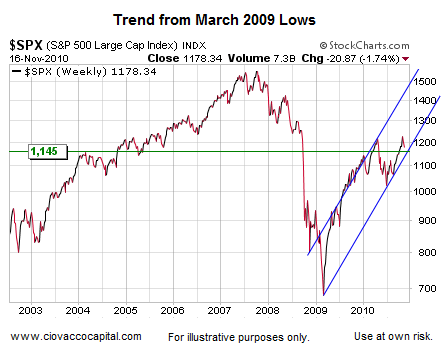
The chart below looks at the trendlines from the March 2009 lows. It appears as if the S&P 500 would intersect with the lower blue trendline somewhere in the neighborhood of 1,145.
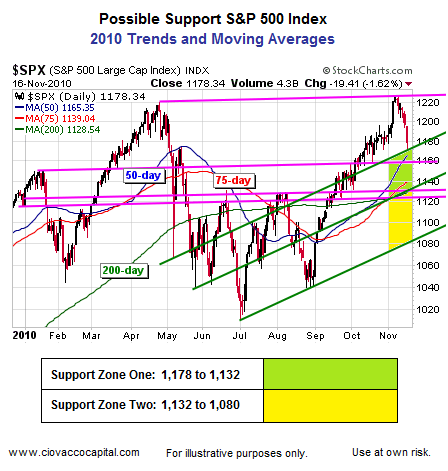
This chart (below) looks at a much shorter-term view. The green lines are parallel trendlines from the July 2010 lows. The pink lines are parallel trendlines connecting the April and November 2010 highs. Moving averages for the S&P 500 are shown via the blue, red, and green thin lines. This chart has two major zones of potential support highlighted in green and yellow. A break of the lower green trendline would be a cause for concern (currently near 1,080).
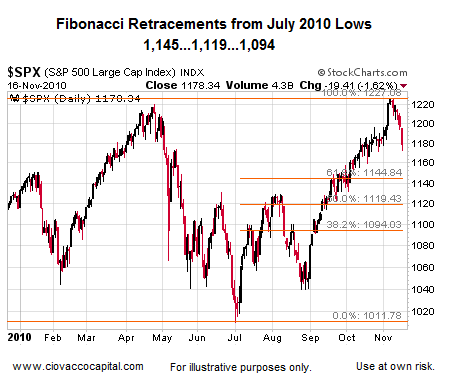
Traders often watch Fibonacci retracement levels; so it pays to keep these in your back pocket. The basic concept is all markets have natural ebb and flow where “giving back” some gains is a normal part of any healthy market. Retracements bring new buying interest and allow markets to move higher. The chart below shows the retracement levels for the gains made from the summer low to the recent fall 2010 high.
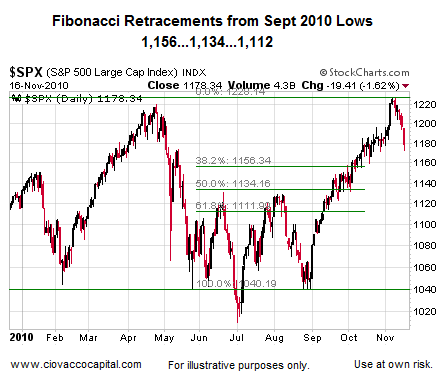
Below, are the levels using the more recent September 2010 low matched with the most recent high in the S&P 500.
The summary table at the top of this page aggregates the areas of possible support garnered from various timeframes and various methods. In the short-to-intermediate term, the key levels where buyers may become interested in risk assets correspond to S&P 500 levels of 1,156, 1,144, and 1,132. Trendlines, support, and retracements levels are violated commonly in all markets, which speak to the probabilistic nature of this analysis. A break of 1,144 on the S&P 500, especially on a weekly closing basis, would increase the odds that any pullback may be more than a normal correction within a healthy market. Developments in Europe and new fundamental data need to be factored into all investment decisions, and should be used in conjunction with possible areas of buying support.
By Chris Ciovacco
Ciovacco Capital Management
Copyright (C) 2009 Ciovacco Capital Management, LLC All Rights Reserved.
Chris Ciovacco is the Chief Investment Officer for Ciovacco Capital Management, LLC. More on the web at www.ciovaccocapital.com
Ciovacco Capital Management, LLC is an independent money management firm based in Atlanta, Georgia. As a registered investment advisor, CCM helps individual investors, large & small; achieve improved investment results via independent research and globally diversified investment portfolios. Since we are a fee-based firm, our only objective is to help you protect and grow your assets. Our long-term, theme-oriented, buy-and-hold approach allows for portfolio rebalancing from time to time to adjust to new opportunities or changing market conditions. When looking at money managers in Atlanta, take a hard look at CCM.
All material presented herein is believed to be reliable but we cannot attest to its accuracy. Investment recommendations may change and readers are urged to check with their investment counselors and tax advisors before making any investment decisions. Opinions expressed in these reports may change without prior notice. This memorandum is based on information available to the public. No representation is made that it is accurate or complete. This memorandum is not an offer to buy or sell or a solicitation of an offer to buy or sell the securities mentioned. The investments discussed or recommended in this report may be unsuitable for investors depending on their specific investment objectives and financial position. Past performance is not necessarily a guide to future performance. The price or value of the investments to which this report relates, either directly or indirectly, may fall or rise against the interest of investors. All prices and yields contained in this report are subject to change without notice. This information is based on hypothetical assumptions and is intended for illustrative purposes only. THERE ARE NO WARRANTIES, EXPRESSED OR IMPLIED, AS TO ACCURACY, COMPLETENESS, OR RESULTS OBTAINED FROM ANY INFORMATION CONTAINED IN THIS ARTICLE. PAST PERFORMANCE DOES NOT GUARANTEE FUTURE RESULTS.
Chris Ciovacco Archive |
© 2005-2022 http://www.MarketOracle.co.uk - The Market Oracle is a FREE Daily Financial Markets Analysis & Forecasting online publication.