


Strengthening U.S. Dollar To Send Gold and Stock Market Lower
Stock-Markets / Financial Markets 2010 Nov 16, 2010 - 02:42 AM GMTBy: Lorimer_Wilson

 Dr. Nu Yu writes: Technical analyses suggest that the U.S. dollar index could well see resurgence in the short term with both gold and the various U.S. stock markets undergoing +5% corrections while the Chinese stock market rebounding from last week’s set-back on its way to record levels. Let me explain in detail:
U.S. Dollar Index Showing Signs of Strengthening (By 4%)
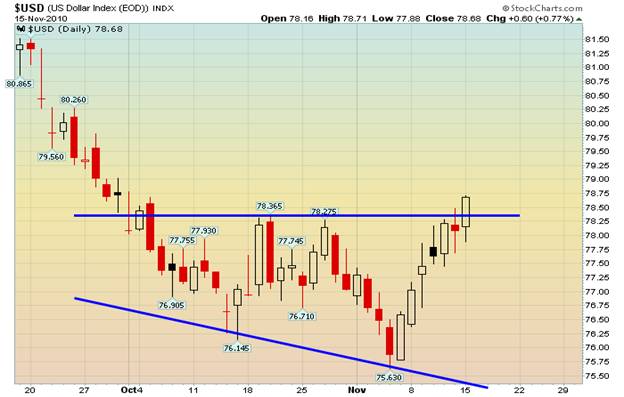
The U.S. dollar index is forming a 6-week Broadening Descending Right-Triangle pattern bounded by an upper horizontal line and a lower downtrend line as shown in the chart below. This pattern, megaphone shaped with starting narrow fluctuations and then widening out between diverging boundary lines, usually acts as a bullish reversal if it occurs in a mature downtrend but it can only be realized if the price breaks out to the upside of the broadening pattern.
The U.S. dollar index has a short-term key resistance level of 78.30 which is the horizontal line of the broadening triangle pattern. Last week the dollar rebounded from its new 52-week low, and now it is testing the upper boundary of the broadening pattern. Once the horizontal resistance is breached, an upside price target could be projected at 81.
Price of Gold Showing Signs of Weakening (By 6.5%)!
Due to the current strong negative correlation between gold and the dollar and also between the stock market and the dollar, this potential bullish move of the dollar could generate corresponding technical corrections for gold and the stock market. In particular, it could impact gold causing it to fall by approximately $90 from the current price of $1,368 to the projected price of $1,278, i.e. decline 6.5%.
U.S. Stock Market Showing Signs of Weakening (By 5%)!
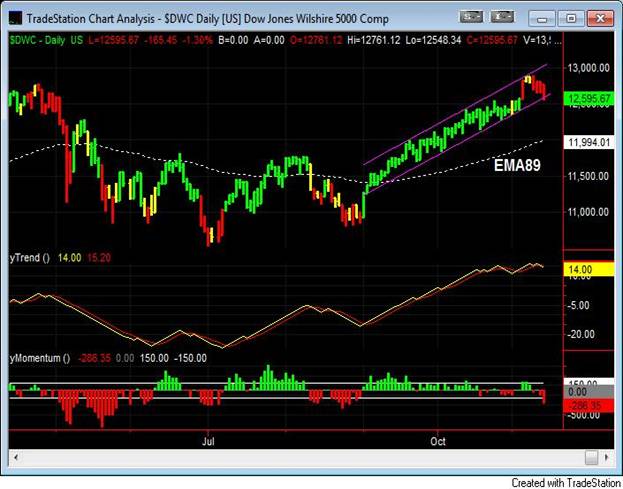
The Dow Jones Wilshire 5000 index, as a benchmark of the total U.S. equity market, formed a short-term top peaked at 12970 just about 30 points shy of 13000 which is a price target projected by the Inverted Roof pattern. Last week the index pulled back off the 52-week high and reached the lower boundary of the 9-week uptrend channel with market weakness shown by negative readings from both the trend and momentum indicators. If the Wilshire 5000 index breaks through the support at the lower boundary of the channel, the stock market could enter a downside correction towards the 89-day exponential moving average near 12000 which implies a decline almost 5% below the current level.
My proprietary Leading Wave Index (LWX) indicator, color coded in the price bars of the following daily chart of the Wilshire 5000 index, has turned bearish. Based on the forecast of the LWX indicator, the market is now in the bearish time-window that could last weeks until higher market volatility is released.
Market Volatility Remains Low
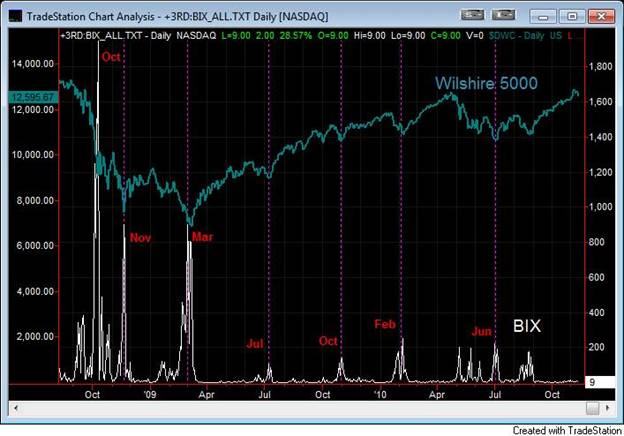
The Broad Market Volatility (BIX), measured from over 8000 U.S. stocks, closed at 9 last Friday and remains well below the panic threshold level of 46 indicating that the current market is bullish. The BIX is plotted in the following chart as compared with the Wilshire 5000 index.
Chinese Stock Market Showing Increased Volatility
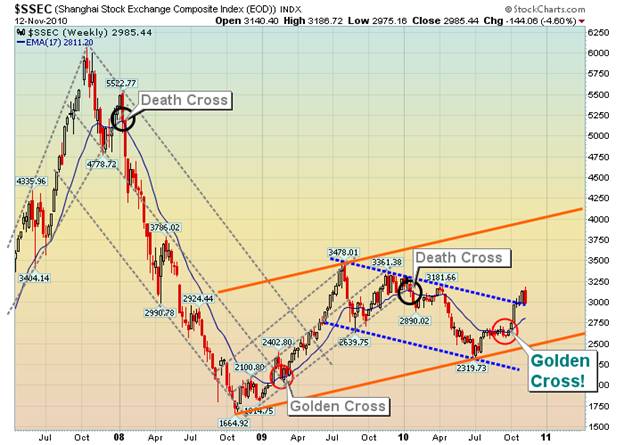
The chart below shows that China’s Shanghai Stock Exchange Composite Index (SSEC), while forming a potential uptrend channel (the orange lines), dipped last week after China reported higher-than-expected inflation. Renewing concerns that China's central bank will raise interest rates again may also add some volatility into the market in the short-term. In spite of the aforementioned the SSEC is projecting an index target of 4200 by mid-2011.
There you have it. The long-term trends for gold, the U.S. dollar, the U.S. stock market and the Chinese stock market continue to unfold as our analyses have forecast with slight hiccups along the way.
Please Note: Don't forget to sign up for munKNEE’s FREE weekly "Top 100 Stock Market, Asset Ratio & Economic Indicators in Review"
Dr. Nu Yu (fx5186.wordpress.com/), co-founder and president of Numarkan Investments and an affiliate of the Market Technician Association, is a frequent contributor to www.munKNEE.com
Visit http://www.FinancialArticleSummariesToday.com, “A site/sight for sore eyes and inquisitive minds”, and www.munKNEE.com, “It’s all about MONEY”, where you can sign up for their FREE weekly "Top 100 Stock Market, Asset Ratio & Economic Indicators in Review."
© 2010 Copyright Dr. Nu Yu - All Rights Reserved
Disclaimer: The above is a matter of opinion provided for general information purposes only and is not intended as investment advice. Information and analysis above are derived from sources and utilising methods believed to be reliable, but we cannot accept responsibility for any losses you may incur as a result of this analysis. Individuals should consult with their personal financial advisors.
© 2005-2022 http://www.MarketOracle.co.uk - The Market Oracle is a FREE Daily Financial Markets Analysis & Forecasting online publication.