


Stock Market Trending for a Top or Just Quantitative Selling?
Stock-Markets / Stock Markets 2010 Nov 14, 2010 - 05:53 AM GMTBy: JD_Rosendahl

 The stock markets are very over bought on the daily time frame and due for some corrective behavior. The question has to be what part of the cycle will this corrective behavior fill? Is it a major top? Or just simple corrective selling pressure post run up to quantitative easing?
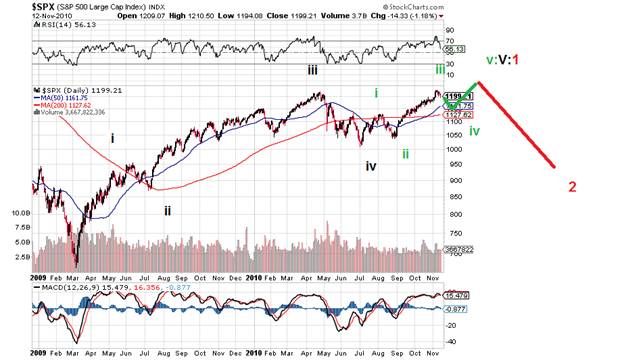
There are two Elliott Wave counts that seem to be very common. The bullish and bearish view!
Bullish View: In this view we are looking at completed waves i-iv and we are failing to move above the April top. It could be a double top or what I've labeled in the bullish view as a wave iii. In that light, we should go through a correctional phase (wave iv) before wave v up to finish wave V of a larger wave 1. That is the classic bullish view.
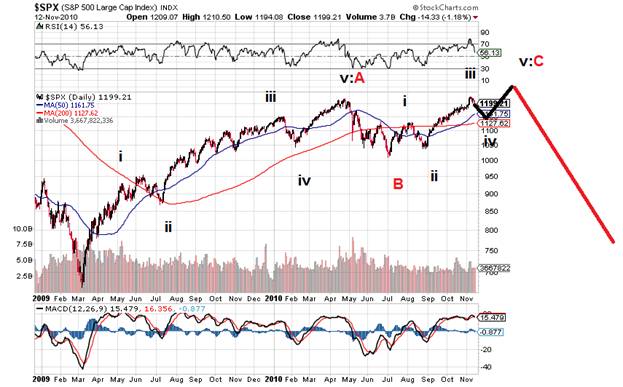
Bearish View: In the bearish view, it's the classic zig-zag higher with waves A and B completed and wave C underway. In that light, wave C is failing at the April high in what looks like a wave iii of C and waves iv and v are to follow to finish this ABC pattern.
Why do both views need the exact same wave structure to complete different (bullish and bearish) views? Two reasons make sense to me. First, Mr. Market often will push price into a place and time that keeps both views alive, this keeps the game complex and challenging. Price correcting into a wave iv then moving higher into wave v to finish either a larger wave 1 or C will not let market participants know and keep the game complex. At the end of 1 or C, both views then call for a correction, either a wave 2 in the bullish view or something larger in the bearish view. Mr. Market does this all the time.
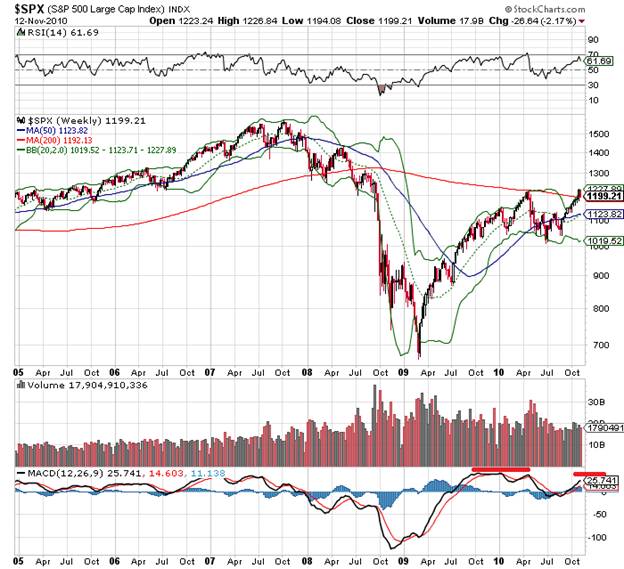
Secondly, when we look at the market technically from the perspective of the weekly and month MACDs, a major top right now doesn't make any sense because the monthly and weekly MACDs are nowhere near rolling over to support a post wave 1 or C correction. To roll over the weekly and month MACDs to support a larger correction, we are going to need several more weeks in time.
$SPX Weekly: Below is the weekly chart of the market. If the market corrects into wave iv and then advances into wave v of either 1 or C as highlighted above those two moves should allow the market to create a top, pull the BBs together and create a divergence on the weekly MACD. Both the bullish and bearish view can accomplish this task.
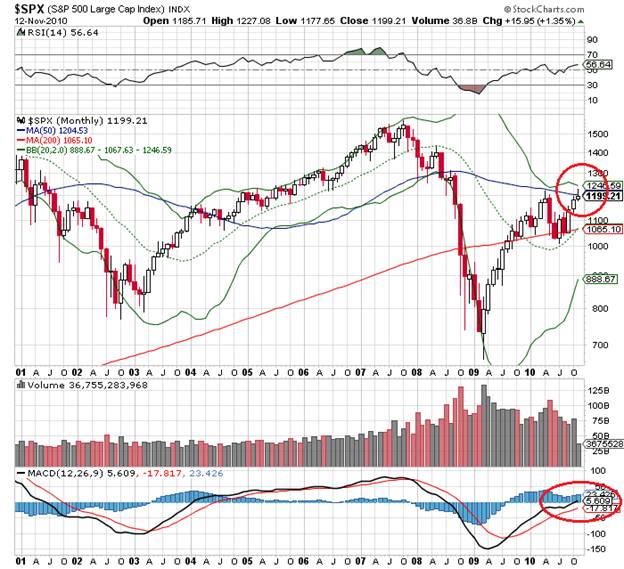
$SPX Monthly: The monthly chart is below. Again, the expected wave iv down and wave v up of 1 or C should pull the MACD up to the zero line, an area for a classic market reversal. I like the idea of a weak wave v test of the upper BB and then price failure.
Rosey's Call: When will the stock market make a more definitive top? S&P Strength Will Wain in March: Charts
The upward trend in the S&P 500 is likely to continue and will peak in March, after which investors will turn more bearish, independent trader Bill McLaren told CNBC on Friday.
“We clearly have an exhaustion of some sort on the chart and that does represent some risk. But the move down since then has been 22-¾ points in four days which keeps the trend intact,” McLaren said.
“We could have another little shot up…If we do get a kick up, it will die at 1,235 or 1,247 (points),” he said.
McLaren said insiders are selling at a rate he has not seen before, with hardly any insider buying.
But despite this risk, he still sees a continuation of the upward trend.
“I still like March for the end of the bull campaign with some risk at the end of November or the first week in January at 100 days from low,” he said
I like Bill's perspective a great deal. We are heading into end of November with the market over bought and due for some corrective behavior. I feel it will be just that and then we move higher again. If I convert his comments into Elliott Wave, he's suggesting wave iv and then v, just like my carts above. If I convert his comments into the MACD, he's saying we need a correctional phase and another advance to bring price and the MACD into a position that would support a greater correction.
My Primary View: Elliott Wave Analysis, Wave 3 Down?, and Quantitative Easing:
My personal alternative view is if the market is going to trade higher, then a natural place for a top is when both the weekly and monthly MACDs are above zero. That will take a few more months and I personally like the December 2010 to January 2011 time frame because that represents the 21 Fibonacci number on a monthly count from the March 2009 low, and my time frame represents the 21/22 month cycle.
I personally like the January period because of the 21 cycle time frame, which often turns into 22. But the March time frame Bill refers to would complete 2 years of bull market. To some degree, I think we are saying similar things. We are both expecting corrective behavior now with a more definitive top in the 1st quarter of 2011.
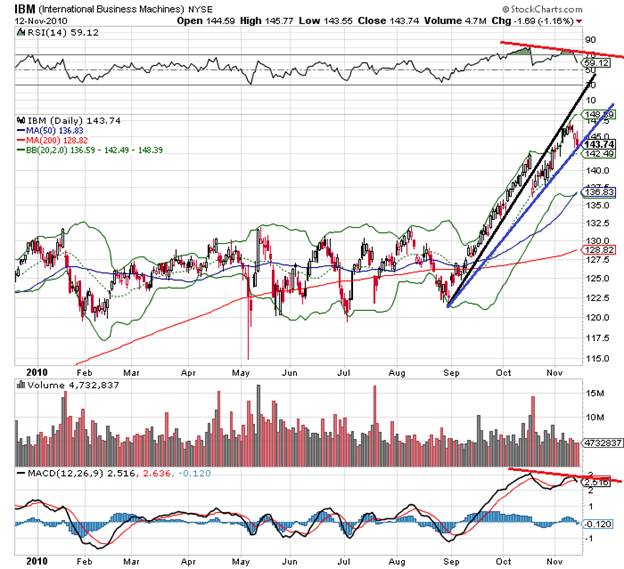
IBM: The stock is building some bearish divergences on both the MACD and RSI. Both are ready to move lower with price breaking below the blue uptrend line. IBM moving lower is bearish for the market, it's just too big a component of the Dow Jones.
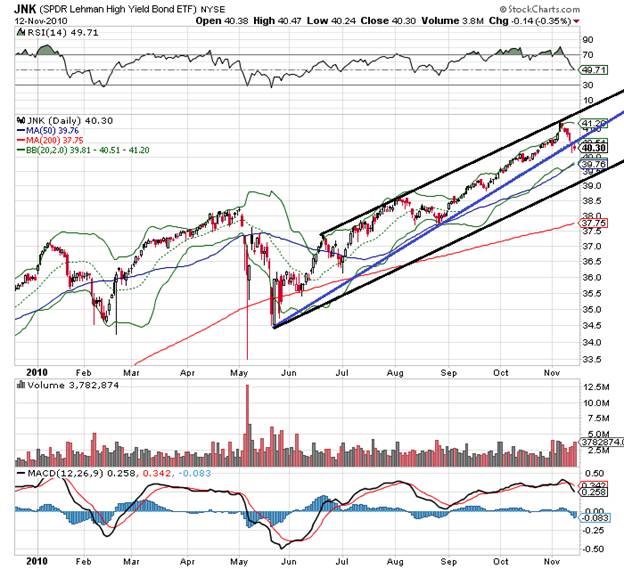
JNK: Is the junk market in a bubble: Junk Bubble? And, is it ready to pop?
Below, we see price has finally fell below the blue uptrend line. That's bearish for the time being. The black channel lines give the index context. We could easily test the bottom channel line and still be in bullish mode for JNK. As long as it's heading lower, it's a bearish indicator of risk and thus the market.
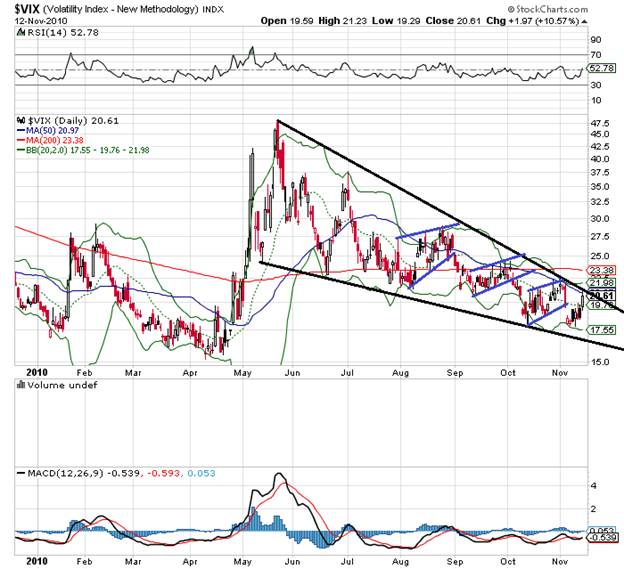
$VIX: A reader wanted me to expand a little on my thoughts regarding the $VIX. We’ve been in a large wedge structure down, which is bullish for the $VIX if and when broken and conversely bearish for the market. Within this greater wedge pattern are smaller little wedges or consolidation patterns in blue that have been bearish for the $VIX and supporting the market higher.
If you've read my blogs you’ve probably read my terminology of Time Frame Indifference. When you see a pattern like this larger wedge on the $VIX expand like it has and the daily MACD continues to move sideways like it has, those are classic indications of Time Frame Indifference. It’s telling us there’s a more powerful move in price and/or time because the pattern is stalling and the MACD is failing to reverse. When you see time frame indifference it always makes sense to turn to next longer time frame for analysis because it’s dominating the shorter time period.
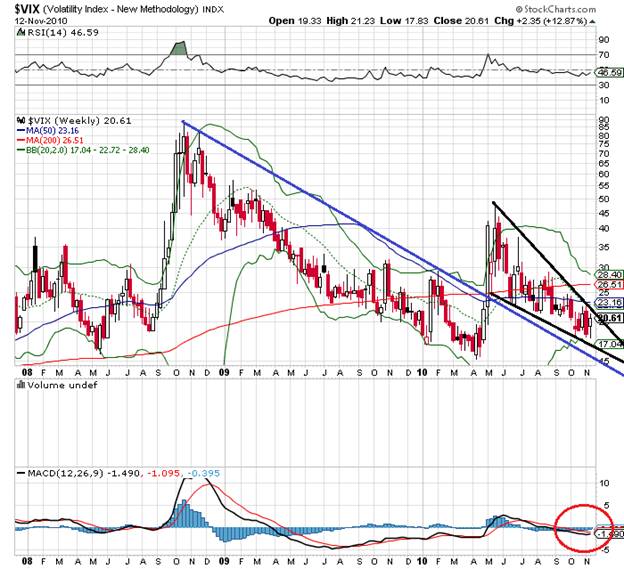
Clearly, the weekly chart below is dominating the daily time frame. The MACD is drifting and failing to turn up each time the $VIX tested the downtrend line. What's starting to look bullish for the $VIX is the current bottom forming is doing so above the lower BB which is exactly what happened on the April low. If we are looking for corrective behavior in the stock market, it's the weekly chart of the $VIX we need to watch for better confirmation. A break higher with a turn up on the weekly MACD is bullish the $VIX bearish for Mr. Market.
For other markets ($COMPQ, $TRAN, $GOLD, $USD, and IYR) go to: www.roseysoutlook.blogspot.com
Hope all is well.
By J.D. Rosendahl
www.roseysoutlook.blogspot.com
J.D. Rosendahl was a former stock broker/investment consultant (currently not licensed) before becoming a Commercial Banker for the past 14 years. He manages his family's wealth, helping them avoid the high tech bubble and the real estate bubble melt downs and preserving wealth.
© 2010 Copyright J.D. Rosendahl - All Rights Reserved
Disclaimer: The above is a matter of opinion provided for general information purposes only and is not intended as investment advice. Information and analysis above are derived from sources and utilising methods believed to be reliable, but we cannot accept responsibility for any losses you may incur as a result of this analysis. Individuals should consult with their personal financial advisors.
© 2005-2022 http://www.MarketOracle.co.uk - The Market Oracle is a FREE Daily Financial Markets Analysis & Forecasting online publication.