Stock Market Reverses at 61.8% Level, Gold Unconfirmed New Highs
Stock-Markets / Stock Markets 2010 Nov 13, 2010 - 04:36 PM GMT  The FDIC Failed Bank List announced three new bank closures this week. As of the latest report released by the FDIC there were 829 problem banks at June 30, 2010 up from 775 at March 31. Total assets held by the troubled institutions is $403.0 billion, a slight decrease from $431 billion in the previous quarter.
Is QE2 A Stealthy $90 Billion Gifting Scheme To The Primary Dealers?
(ZeroHedge) We have previously discussed how due to the inability to know at what price (par or market) the Fed is buying back bonds from the Primary Dealers, there is a distinct possibility that due to the par-market difference, especially with many CUSIPs trading near record prices over par, the Fed may be implicitly letting PDs pocket the market-to-notional difference. The total, as shown below, could amount to over $40 billion. Furthermore, by avoiding the tight spread of on the run bonds, the Fed is effectively allowing PDs to pocket a huge bid/offer spread, which assuming a total size of ~$800 billion (low estimate) of all USTs bought over the (initial) life of QE2, aka QE2.5 and higher pre-extensions, amounts to $50 billion over the next 8 months.
David Tepper Dumps 20% Of Financial Holdings During Quarter Of Infamous CNBC Speech
(ZeroHedge) Guess who, after on September 24 David Tepper almost screamed that he was "balls to the wall long" and EVERYTHING was about to go up on QE2, you were very likely buying shares Bank of America and Citigroup from? Why, David Tepper, that's who.
Will the VIX break out this week?
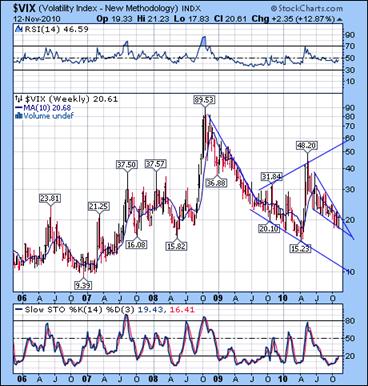 --The VIX closed at the upper trendline of its wedge and pennies below its 10-week moving average at 20.68. On Tuesday the VIX made a marginal new low, invalidating its old sell signal. Monday is a Pivot day for the VIX. If we do not see a strong breakout above the 10-week moving average early in the week, chances are that we may see a revisit to the bottom of the Wedge formation.
Volatility has been on a secular rise since December 2006. If it follows the prior two repetitions, it may top in 2011. The Broadening Formation and Declining Wedge indicate a much higher VIX in the weeks to come.
SPX reversed at the 61.8% retracement level.
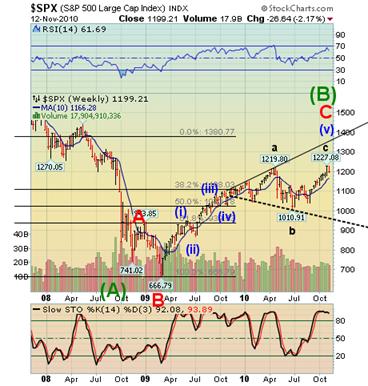 The SPX reversed from its 61.8% Fibonacci Retracement of the 2007-2009 decline. The pattern left this week in the SPX could be construed as an unfinished impulse. A further drop on Monday may clarify the wave pattern.
None of the other analysts recognize the Orthodox Broadening Top in his analysis. We appear to be in the final iteration of the OBT. My Model suggests that we may see a bnce at or above the 10-week moving average at 1166.28 during options week. A failure at that level has the potential of starting a waterfall in the SPX.
The NDX 5-point reversal may be finished.
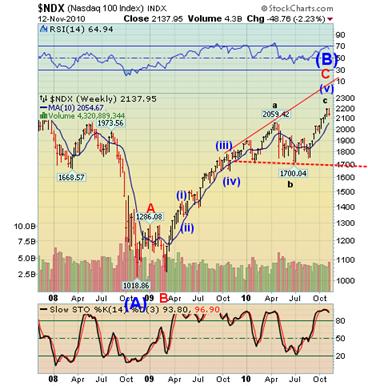 --The Orthodox Broadening Top may have reached completion at this week’s high. The next testing area appears to be the 10-week moving average at 2054.67. My Model suggests a slightly higher support (2080), which may be reached on Tuesday or Wednesday.
If this week follows an oft-travelled path, we may see a short-term low by mid-week and a wave ii secondary peak by Friday.
Trading volume has risen on a down week, however, indicating that things may not follow their usual course.
New highs in Gold are not confirmed.
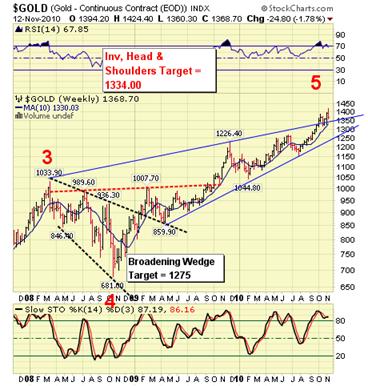 -- Gold started the week off on a higher note, hitting my target of 1420-1425. However, it reversed later in the day as suggested in last week’s report. The next level of support is the 10-week moving average at 1330.03. However, my Model suggests a lower support closer to 1300. This would bring gold back within its Wedge formation and a confirmed sell signal.
The issue with QE2 is that the Fed has no power over where the new liquidity goes. It appears that Friday’s POMO may have been used to bolster short positions in all assets.
$WTIC completed a seventh wave within its Broadening Top.
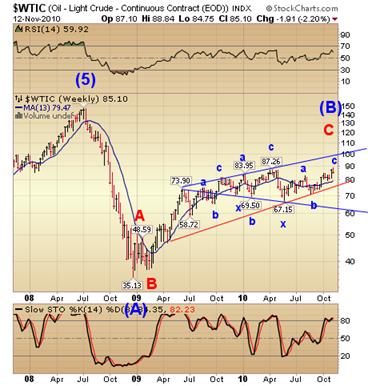 -- $WTIC completed a 7th point in its Broadening Top. Since this is often called a 5-point reversal pattern, Edwards & McGee refer to the final point as 5b in their test on the Orthodox Broadening Top. 5a would be the April 15th high. These patterns are rare enough that few have even catalogued Broadening Formations, much less studied their behavior.
Since most Elliott Wavers do not recognize the Broadening Top, I have labeled it as an ungainly but acceptable triple zig-zag. The message is clear. After 16 months of corrective chaos, the price of oil is about to plunge.
The Bank Index stalled just above support.
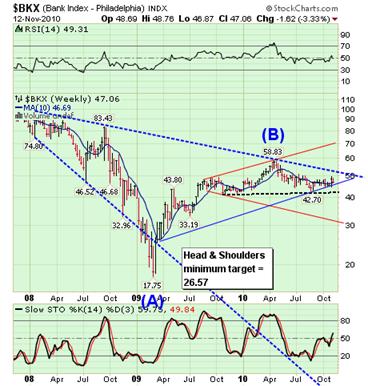 --The $BKX stalled just above the lower trendline of its Diamond formation and the 10-week moving average at 46.69. The sell signal in BKX is activated when the lower trendline between 46.00-46.50 is broken. The pattern calls for a swift decline to the mid-30s, close to the Broadening Top lower trendline.
Today, Bank of America filed its first official response, and exposed how it plans on defending itself, to the recently launched RICO case by the Davis family (Southern Illinois, 10-01303), seeking monetary damages for what they now claim is a fraudulent eviction on the ground that the affidavit was signed by two Robosigners: one Keri Selman and one Melissa Viveros.
The Shanghai Index reversed at a potential neckline.
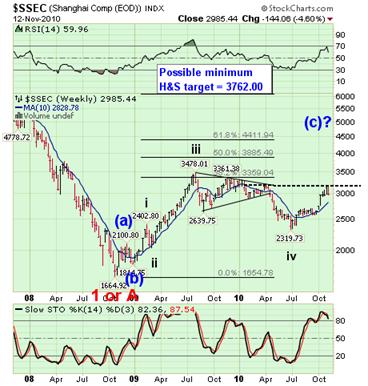 --The Shanghai Index reversed from the apex of its triangle, leaving a potential Head & Shoulders neckline. What happens next will be very important. A lesser pullback to form a right inverted shoulder may give us a new Head & Shoulders pattern with a target near the 50% retracement of its initial Super Cycle decline.
One of the unforeseen results of QE2 is that money is going to feed emerging market stock indexes, especially China’s. If that indeed is the case, we should see a muted decline, followed by a strong rally higher in Chinese stocks.
$USB made a new low and a possible double zig-zag.
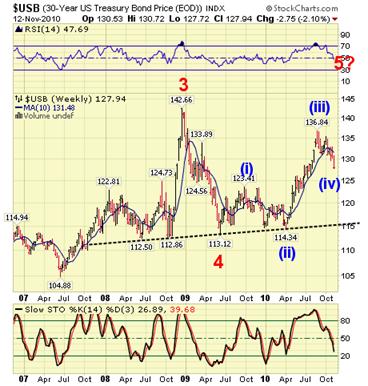 -- $USB may have completed a double zig-zag at its low this week. It undershot its Model support at 129.56, but may find support at its weekly Cycle support at 127.32. TLT has made a reversal pattern this week and both TLT and $USB have a Pivot on Monday. Should the equities market fail, the long bond will be sought after as a safe haven for investors. The bond short trade is getting crowded.
The Treasury’s $16 billion auction of 30-year bonds on Nov. 10 drew a bid-to-cover ratio, which gauges demand by comparing total bids with the amount of securities offered, of 2.31, the lowest since November 2009.
$USD approached its 10-week moving average.
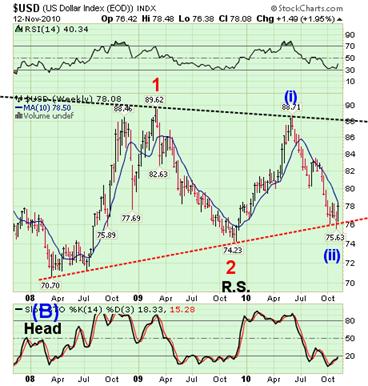 -- $USD confirmed a daily buy signal last week and may broach its weekly buy signal this week. It broke above its October highs, giving an indication of future strength. It appears that pullbacks from here may be small.
The dollar gained against all of its 16 most-traded counterparts this week as risk-averse investors sought it as a refuge. The euro trimmed its five-day loss yesterday on speculation the European Union will bail out Ireland, while the Group of 20 leaders at a summit agreed to develop early-warning indicators to head off global economic turmoil.
I hope you all have a wonderful weekend!
Regards,
Traders alert: The Practical Investor is currently offering the daily Inner Circle Newsletter to new subscribers. Contact us at tpi@thepracticalinvestor.com for a free sample newsletter and subscription information.
Our Investment Advisor Registration is on the Web
We are in the process of updating our website at www.thepracticalinvestor.com to have more information on our services. Log on and click on Advisor Registration to get more details.
If you are a client or wish to become one, please make an appointment to discuss our investment strategies by calling Connie or Tony at (517) 699-1554, ext 10 or 11. Or e-mail us at tpi@thepracticalinvestor.com .
Anthony M. Cherniawski, President and CIO http://www.thepracticalinvestor.com
As a State Registered Investment Advisor, The Practical Investor (TPI) manages private client investment portfolios using a proprietary investment strategy created by Chief Investment Officer Tony Cherniawski. Throughout 2000-01, when many investors felt the pain of double digit market losses, TPI successfully navigated the choppy investment waters, creating a profit for our private investment clients. With a focus on preserving assets and capitalizing on opportunities, TPI clients benefited greatly from the TPI strategies, allowing them to stay on track with their life goals
Disclaimer: The content in this article is written for educational and informational purposes only. There is no offer or recommendation to buy or sell any security and no information contained here should be interpreted or construed as investment advice. Do you own due diligence as the information in this article is the opinion of Anthony M. Cherniawski and subject to change without notice.
Anthony M. Cherniawski Archive |
© 2005-2022 http://www.MarketOracle.co.uk - The Market Oracle is a FREE Daily Financial Markets Analysis & Forecasting online publication.


