


Has the Stock Market Internet Index Peaked ? if so, What Now?
Stock-Markets / Tech Stocks Nov 12, 2010 - 04:16 AM GMTBy: Garry_Abeshouse
 I have chosen to highlight the Internet Index at this time, as it represents the business sector that dominates the hearts, minds and the deep wallets
of Gen Y - those born during or after the 1980's. It is ironic that prior to the 1980's the stock market was dominated by companies making the
necessities of life, while you might say that the stockmarket of today is dominated by companies dealing with services that we are told we
cannot live without.
I have chosen to highlight the Internet Index at this time, as it represents the business sector that dominates the hearts, minds and the deep wallets
of Gen Y - those born during or after the 1980's. It is ironic that prior to the 1980's the stock market was dominated by companies making the
necessities of life, while you might say that the stockmarket of today is dominated by companies dealing with services that we are told we
cannot live without.
Our world is now one, where the concept of intrinsic value has been almost totally replaced by the vicissitudes of excess
marketing, spin and disposable product.
Unlike most of the other US indices, the CBOE Internet Index is an equal-dollar weighted index composed of companies involved in providing
Internet access services, as well as the design and manufacture of software and hardware that facilitates Internet access. The Index is
re-balanced quarterly after the close of trading on the third Friday of March, June, September and December. (Source Wikipedia)
From a charting perspective this usually means it will tend to trend better over time compared to other indices and indeed this appears to be the case here.
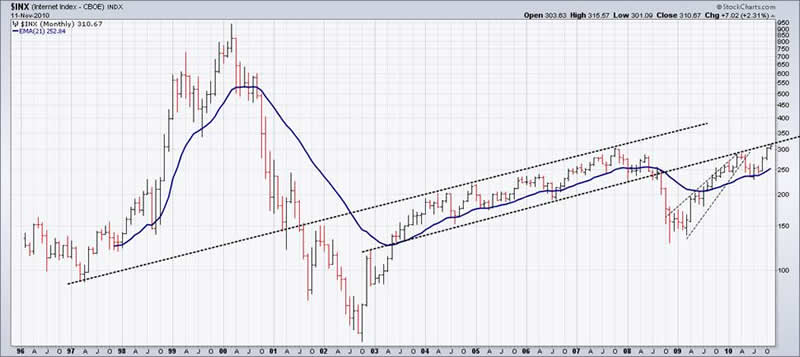
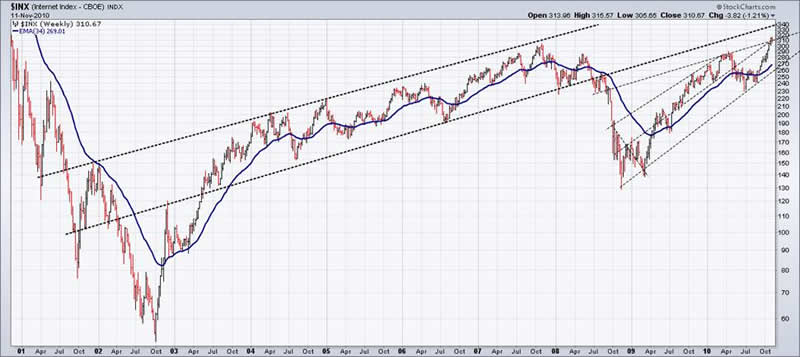
Below you will find a series of bar charts ranging from monthly time periods, through weekly, daily and finally 60 minute charts to highlight the
current market position of the Internet Index.
The monthly chart below highlights the Tech bust between 2000 and 2003, with the chart showing surprisingly little growth after 2005 - despite
most of the technical advances being made in this sector during that latter time period. The 2008 crash saw a break down through the support
trend line, with a pull back to this trend line in the period after March 2009, In fact this is where the price stopped dead as of the last few days.
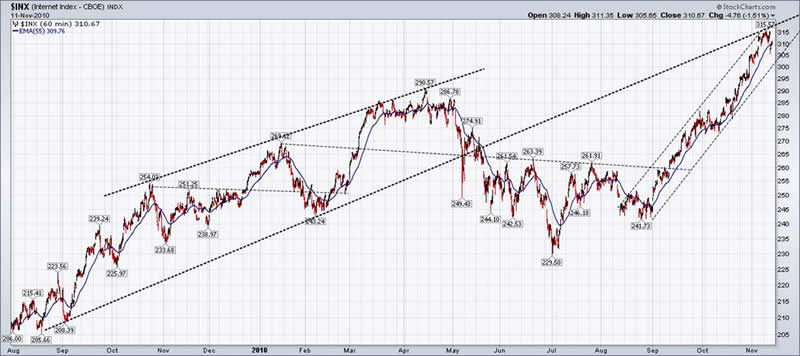
Perusing through the other charts, homing down to the more sensitive intraday 60 min chart, highlights the end of a second "measured move" exactly as it hits the eight year trend line.
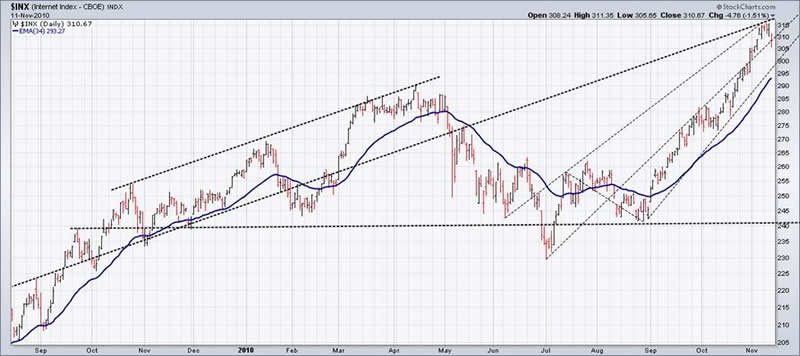
This final upward move from September 2010 to where the price sits now, (see the daily and 60 min charts) has coincided with blow-out style
moves in many market leaders such as Apple, Google, Baidu, Infosys, Oracle, EBay etc. In many ways the recent moves of the internet leaders,
reminds me of the final blow out move of the Australian mining market in 1969.
My current view is that the recent high of 315 in this index will probably be at least a short to medium term peak for this index and
depending upon what happens over the coming weeks, could even be a sign that the whole market has run out of puff and the bear
has finally returned.
Till next time.
Garry Abeshouse
Technical Analyst.
Sydney
Australia
I have been practicing Technical Analysis since 1969, learning the hard way during the Australian Mining Boom. I was Head Chartist with Bain & Co, (now Deutsch Bank)in the mid 1970's and am now working freelance. I am currently writing a series of articles for the international "Your Trading Edge" magazine entitled "Market Cycles and Technical Analysis".
I have always specialised in medium to long term market strategies and after discovering the excellent Point & Figure Charts from Stockcharts.com in mid 2008, have concentrated on this style of charting ever since.
© Copyright Garry Abeshouse 2010
Disclaimer: The above is a matter of opinion provided for general information purposes only and is not intended as investment advice. Information and analysis above are derived from sources and utilising methods believed to be reliable, but we cannot accept responsibility for any losses you may incur as a result of this analysis. Individuals should consult with their personal financial advisors.
© 2005-2022 http://www.MarketOracle.co.uk - The Market Oracle is a FREE Daily Financial Markets Analysis & Forecasting online publication.