U.S. Dollar, Euro, Gold, Silver, and VIX Poised For Trend Reversals
Stock-Markets / Financial Markets 2010 Nov 10, 2010 - 09:22 AM GMTBy: Chris_Ciovacco
 Numerous factors and markets are telling us the odds of short-to-intermediate-term reversals are elevated for numerous markets including silver (SLV), gold (GLD), the U.S. dollar (UUP), the euro (FXE), stocks (SPY), and the VIX (VXX). The objective of both fundamental and technical analysis of the financial markets is to help us better understand the risk-reward ratio and relative attractiveness of a wide variety of investments. Since no chart or annual report can help us predict the future, our study of markets deals in probable outcomes.
The possible drivers for market reversals in dollar, euro, gold, silver, and VIX include:
- Concerns about Irish debt
- Uncertainty related to the G20 summit
- High levels of optimism (bullish sentiment/contrarian indicator)
- Near vertical, and correction-less ascents in numerous markets
- Mania-like moves in gold and silver
- Stretched valuations
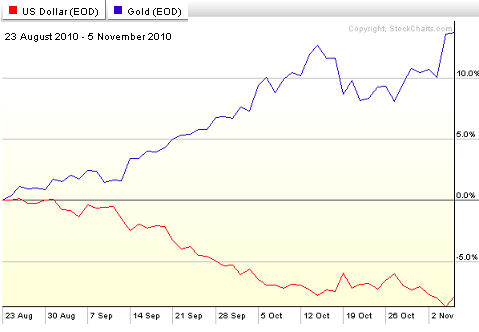
We at CCM, along with many others, believe the sharp gains in many asset classes off the summer lows were primarily driven by the expectation of money printing and a weaker dollar. As the dollar weakened, many risk assets or inflation-protection assets rose. One example is gold; note the negative correlation between the yellow metal and the U.S. dollar.
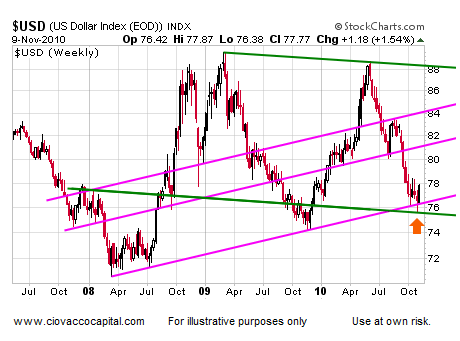
These charts can help us from both a bullish and bearish perspective. If the markets reverse near the areas highlighted below, we would be more apt to become risk averse in the short-term, especially in terms of decisions related to cash. If these markets break through areas of potential resistance, then another leg up in risk assets becomes more likely, and we would be more amenable to increasing risk exposure in the short-term.
Just as a declining dollar increased the appetite for risk over the past five months, a countertrend rally in the dollar may open the door to corrective action in stocks and commodities. The Dollar Bear ETF (UDN) was down Tuesday on a 56% increase over average daily volume. As you review the charts below, ask yourself, “Is this market at a logical point for a possible reversal based on the recent action of buyers and sellers?”
The euro may have reached a point where buyers have become less interested. Recent concerns about Irish debt may also give currency traders a reason to cut back their exposure to the euro. Since the euro makes up roughly 60% of the U.S. Dollar Index, a drop in the euro would help propel the dollar higher. The desire to sell the euro ETF (FXE) was not atypical from a volume perspective on Tuesday, which tells us not to assume anything in terms of a reversal. A decline in FXE over the next few days on strong volume would add credence to the trendline. Average daily volume for FXE over the past three months was 1,556,260 shares. A decline over the coming days on more than 1,867,512 would add to our bearish concerns. A break to the upside on more than 1,867,512 would lean toward favorable outcomes for risk (stocks, commodity-dependent currencies, and commodities).
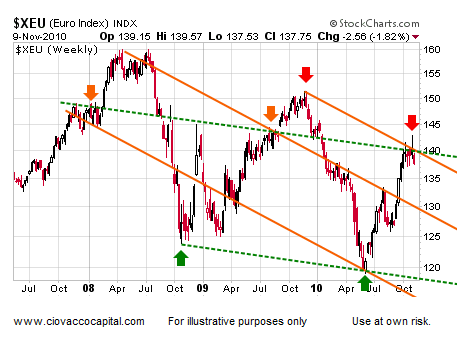
Technical analysis can look complex, but many of the most useful tools are very easy to understand. Trendlines are used to identify areas of past importance in the minds of buyers and sellers. Buyers tend to see value at areas of “support” and sellers tend to see “overvaluation” at areas of resistance.
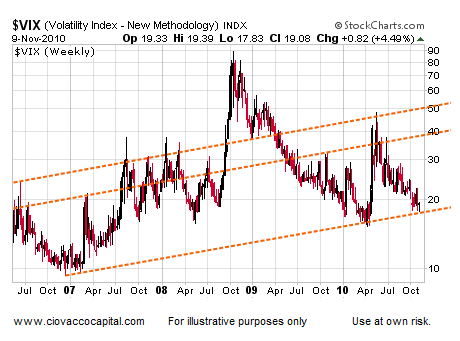
The VIX, or the “fear index”, has reached what many would term as a level of “complacency”. A rise in the VIX, especially a sharp one, often occurs during periods of risk aversion. The VIX ETF (VXX) was up Tuesday on strong volume.
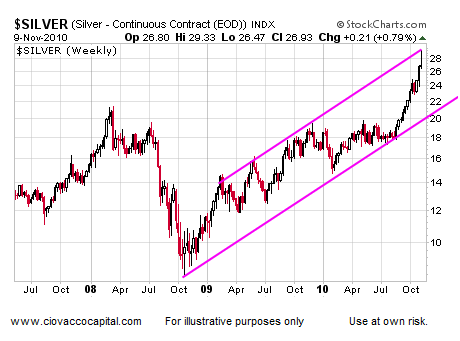
Silver tends to outperform gold during periods of risk-taking and when the economic outlook skews toward the more favorable end of the spectrum. Silver may have experienced a blow-off rally yesterday (SLV). Markets cannot logically rise in a vertical fashion forever; silver will correct at some point. Another day of high-volume selling would increase the odds that Tuesday’s intraday selloff on extremely high volume was indeed significant from a bearish perspective. As we head into trading on Wednesday, silver gets the benefit of the doubt since the bulls have been firmly in control, but Tuesday was a big yellow flag for the silver bulls.
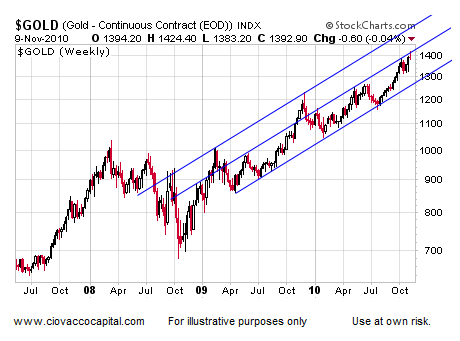
Gold’s appeal has increased as fiat currencies are being debased around the globe. Gold has not had the high degree of mini-mania seen recently in silver, but the yellow metal has also reached a point where the desire to sell may now exceed the desire to buy. The gold ETF (GLD) was down Tuesday on strong volume.
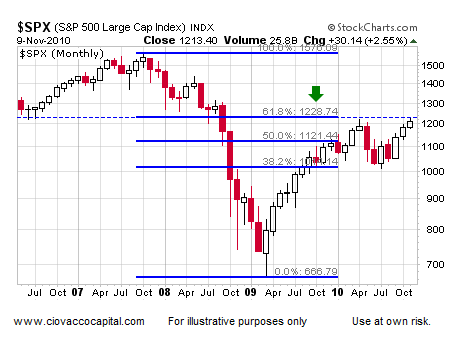
The S&P 500’s intraday high on November 5th was 1,227.08. A 61.8% Fibonacci retracement of the October 2007 to March 2009 bear market falls near 1,228 on the S&P 500. These levels can be important to traders, so it is helpful to keep them on your radar, especially when you have trouble understanding why a market is stalling with no apparent resistance nearby.
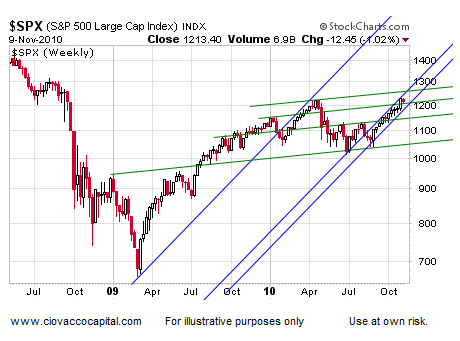
The chart of the S&P 500 seems to be a little better positioned relative to overhead resistance. If stocks can push higher, a move to 1,234ish to 1,256ish on the S&P 500 seems within reason. The S&P 500 ETF (SPY) was down Tuesday on below average volume, which again highlights the need to pay attention rather than assume reversals are going to take place – no one knows what is going to happen, especially over the short-term. Over the summer, many were convinced the Hindenburg Omen spelled doom for the markets; the S&P 500 is now 16.7% above the Hindenburg Omen lows made in late August 2010, which is just one example of the importance of remaining flexible in terms of market outcomes (bullish and bearish).
Trendlines are broken all the time, which reinforces the probabilistic nature of this analysis. We cannot predict the future, but we can say it makes sense to pay attention over the next week or so. With the information we have in hand now, we believe many market reversals will represent corrections within ongoing trends. We believe gold, silver, and stocks will eventually make higher highs after the next correction, which will come at some point. We recently outlined other concerns about the dollar, and concerns about gold, which still apply to the current market.
If you are a little perplexed by the recent gains in inflation-friendly assets, it may be helpful to scan some of the charts on the lower portion of this Quantitative Easing page. The Fed’s objective of re-inflating asset prices and debasing the dollar will probably lend support to gold, silver, and stocks after the next round of corrective activity. Since there will probably be a QE3, QE4, and QE5 over the next few years, it is worth the time to understand how QE works, what the Fed is trying to accomplish, and the possible impact on your purchasing power and investments.
By Chris Ciovacco
Ciovacco Capital Management
Copyright (C) 2009 Ciovacco Capital Management, LLC All Rights Reserved.
Chris Ciovacco is the Chief Investment Officer for Ciovacco Capital Management, LLC. More on the web at www.ciovaccocapital.com
Ciovacco Capital Management, LLC is an independent money management firm based in Atlanta, Georgia. As a registered investment advisor, CCM helps individual investors, large & small; achieve improved investment results via independent research and globally diversified investment portfolios. Since we are a fee-based firm, our only objective is to help you protect and grow your assets. Our long-term, theme-oriented, buy-and-hold approach allows for portfolio rebalancing from time to time to adjust to new opportunities or changing market conditions. When looking at money managers in Atlanta, take a hard look at CCM.
All material presented herein is believed to be reliable but we cannot attest to its accuracy. Investment recommendations may change and readers are urged to check with their investment counselors and tax advisors before making any investment decisions. Opinions expressed in these reports may change without prior notice. This memorandum is based on information available to the public. No representation is made that it is accurate or complete. This memorandum is not an offer to buy or sell or a solicitation of an offer to buy or sell the securities mentioned. The investments discussed or recommended in this report may be unsuitable for investors depending on their specific investment objectives and financial position. Past performance is not necessarily a guide to future performance. The price or value of the investments to which this report relates, either directly or indirectly, may fall or rise against the interest of investors. All prices and yields contained in this report are subject to change without notice. This information is based on hypothetical assumptions and is intended for illustrative purposes only. THERE ARE NO WARRANTIES, EXPRESSED OR IMPLIED, AS TO ACCURACY, COMPLETENESS, OR RESULTS OBTAINED FROM ANY INFORMATION CONTAINED IN THIS ARTICLE. PAST PERFORMANCE DOES NOT GUARANTEE FUTURE RESULTS.
Chris Ciovacco Archive |
© 2005-2022 http://www.MarketOracle.co.uk - The Market Oracle is a FREE Daily Financial Markets Analysis & Forecasting online publication.


