What Macy's and Cisco Charts Tell Us Ahead of Corporate Earnings
Companies / Company Chart Analysis Nov 09, 2010 - 11:44 AM GMTBy: Mike_Paulenoff
 Our Charts of the Week video takes a look at the charts of Macy’s (M) and Cisco (CSCO) ahead of their Wednesday earnings releases.
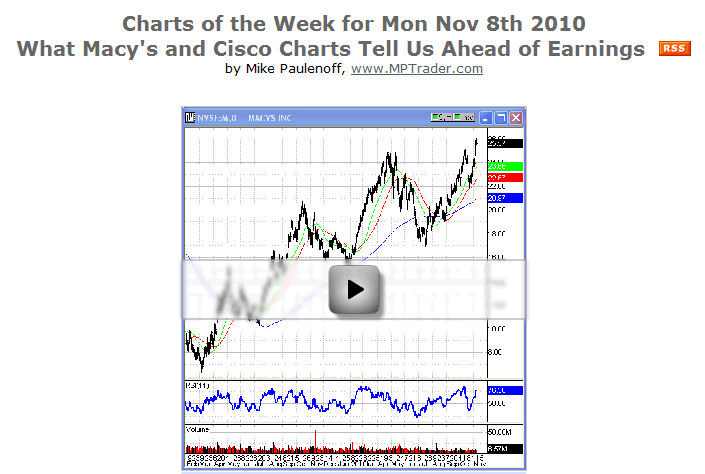
The daily chart of Macy’s going back to Feb 2009 shows a series of higher lows and higher highs. Macy’s believe it or not, despite everything we hear about how bad the economy is and how nobody is buying anything, has been in a major uptrend for quite a while, starting in March 2009. At that time it got down to 6.25 and now is at 25 1/2, after gapping to a new high this past Friday.
The key period on the chart is from the July lows at around 17. Since then, Macy’s has been in a steeper up-channel with its own series of higher highs and higher lows within the larger 2-year channel. Somewhere in the vicinity of 26.80-27, Macy’s will hit top trendline of the July channel.
A break through that could take Macy’s eventually to the top trendline of the larger channel around the 28.80-29.50 area.
Let’s notice that momentum has not made a new high yet, but is still pointed up. If Macy’s goes to 26.60-80 and then pulls back, this momentum will not make a new high, and that will be a warning that Macy’s needs a rest, after a move of 59% since the July low.
This may be due to squeezed margins as a result of higher cotton prices and raw material costs being passed on from the manufacturer to Macy’s.
We’ll see what Macy’s has to say about its forward-looking business prospects in its Wednesday morning announcement, but anything lukewarm could see retail’s entire 4-month upmove coming to an end.
Cisco, a huge behemoth, is a totally different situation than Macy’s, for obvious reasons, but its earnings announcement, too, will have a big impact on its sector. In fact, Cisco’s size and its usual late-in-the-season reporting can often make or break the market.
Cisco made its low on August 31 at 19.82, and since then has been in a very powerful uptrend into Monday’s high at 24.58, a gain of 23-24%.
With a pattern of higher highs and higher lows approaching overbought and nearing its prior peak in RSI, Cisco has something to prove on Wednesday afternoon. With the channel projecting to a 24.80-25 top on Wednesday, if Cisco can take out 25 and hold above it after earnings in the aftermarket, that would be a very positive sign. The prior rally peak occurred at 24.60 in August, so Cisco is back up here probing the prior high.
In addition, if it closes above 25.10, it will be outside the channel and can consolidate and then continue higher.
However, if Cisco gaps up after the announcement but cannot hold for much time above 25 and pulls back below the prior highs to 24.60-.50 and back inside the channel, then I think the upleg in Cisco is also done just like Macy’s, albeit for totally different reasons.
After a great move off the August 31 low, that may be the end of this upmove in terms of selling the news at the top of a major rally. With a move back inside the upper trendline of the channel, Cisco could very well be done, as could the tech sector, if it’s looking for an excuse to roll over into a correction.
Sign up for a free 15-day trial to Mike's ETF & Stock Trading Diary today.
By Mike Paulenoff
Mike Paulenoff is author of MPTrader.com (www.mptrader.com), a real-time diary of his technical analysis and trading alerts on ETFs covering metals, energy, equity indices, currencies, Treasuries, and specific industries and international regions.
© 2002-2010 MPTrader.com, an AdviceTrade publication. All rights reserved. Any publication, distribution, retransmission or reproduction of information or data contained on this Web site without written consent from MPTrader is prohibited. See our disclaimer.
Mike Paulenoff Archive |
© 2005-2022 http://www.MarketOracle.co.uk - The Market Oracle is a FREE Daily Financial Markets Analysis & Forecasting online publication.


