


Common Sense vs. Academic Economist Formulas; Fed Concludes Structurally High Unemployment is a Myth
Economics / Economic Theory Nov 09, 2010 - 06:20 AM GMTBy: Mike_Shedlock

 Ben Bernanke and the Fed have great belief in academic models whether they make any real world practical sense or not.
Indeed, Bernanke's reliance on formulas instead of common sense is what told him there was no housing bubble, that unemployment would not get above 8.5%, and that Quantitative Easing in massive force would cause the unemployment rate to drop. He was wrong on all counts.
Nonetheless Bernanke is sticking to his models. With a hat tip to Zero Hedge, here is yet another article from the Fed (not Bernanke), that places great reliance on academic formulas. The article concludes structural unemployment is "likely to be transitory rather than permanent".
For Academic Wonks Only
Academic wonks may wish to consider the San Francisco Fed article Is Structural Unemployment on the Rise?
If You Understood That Congratulations!Labor demand has been growing in the United States, reflected in a modest increase in private payroll employment this year and a more substantial increase in private-sector job vacancies over the past 12 months. Despite these signs of improvement, the unemployment rate has declined only slightly. Some analysts have raised the specter of a fundamental mismatch between the supply of labor in terms of workers’ skills and demand for labor in terms of employers’ skill requirements. Such a mismatch between available workers and available jobs could increase the level of structural unemployment. To the extent that structural unemployment is actually rising, the phenomenon poses a dilemma for policymakers. It cannot be ameliorated through conventional monetary and fiscal policy. And it implies an increase in the lowest unemployment rate associated with stable inflation, often identified by the acronym NAIRU, which stands for the non-accelerating inflation rate of unemployment.
The Beveridge curve and mismatch
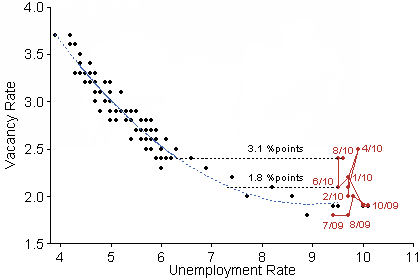
Policymakers and analysts who have posited a rise in structural unemployment have largely focused on the Beveridge curve, a representation of the relationship between the unemployment and job vacancy rates. The Beveridge curve is displayed in Figure 1 for the period since December 2000 when consistent data on vacancies became available from the Bureau of Labor Statistics (BLS) Job Openings and Labor Turnover Survey (JOLTS). The blue dashed line represents an estimation of the empirical relationship between the unemployment and vacancy rates that accounts for the shape of the curve. The sample used for the estimation ends in June 2009, which corresponds to the end of the recession, according to the National Bureau of Economic Research’s Business Cycle Dating Committee. ...
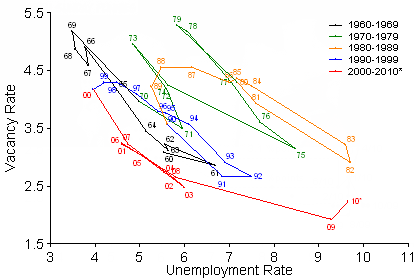
Figure 2 displays the long-term Beveridge curve, relying on a vacancy series constructed using historical data available prior to the introduction of JOLTS (see Valletta 2005 for the methodology). The Beveridge curve shifted rightward about 4 percentage points between the 1960s and the early 1980s and then shifted back about 2.5 percentage points between 1984 and 1989. Based on available estimates, the variation in the NAIRU over these periods was much smaller than the horizontal movement in the Beveridge curve (for example, see Table 1 in Orphanides and Williams 2002).
Credible estimates of the NAIRU over these earlier periods suggest that it may have changed about half as much as the Beveridge curve. This implies that any increase in the NAIRU associated with recent movements of the curve is limited to about 1.25 percentage points, based on the average 2.5 percentage point Beveridge curve shift from January to August 2010.
....
Conclusion
We examined evidence in favor of the view that structural unemployment and the NAIRU have increased during and after the recent recession. Based on historical patterns, the recent shift in the relationship between unemployment and vacancies reflected in the Beveridge curve is consistent with an increase in the NAIRU of about 1¼ percentage points or less. The impact of extended unemployment insurance benefits likely explains about 0.4 to 0.8 percentage point of this increase. The remainder is probably associated with the bursting of the residential real estate bubble and the need for many unemployed construction workers to find work in other sectors. The effects of both of these factors are likely to be transitory rather than permanent.
If you know what Beveridge Curves are and you understood the article, congratulations, you are an academic wonk. More importantly, If you believe there is any merit in the conclusion, you are a fool.
Zero Hedge Chimes In
In Your Taxpayer Dollars At Work: San Fran Fed Asks If Structural Unemployment Is On The Rise, Discovers It Isn't Zero Hedge quips ...
With unemployment stuck at 10% for about a year now, and with the real unemployment rate probably well over 20% if one removes all the BLS gimmicks, by now it is rather clear even to 2 year olds, that the New Abnormal is one where unemployment of 5% is merely a pipe dream, and that the Fed's attempt to revert to an abnormal mean, and blow the biggest bubble ever in the process, will do nothing to fix what is now a new structural baseline unemployment level. And yet, just to prove that the Fed will take taxpayer money and spend it on the most Captain Obvious topics ever, has just released a paper titled "Is Structural Unemployment on the Rise?" Adding insult to monetary injury, paper authors Rob Valetta and Katherine Kuang conclude that not only are worries about a "new normal" misplaced, but that jobs will promptly revert back to old levels. Sure, why not - as we showed previously, it will only take the creation of over 230,000 jobs a month for about 6 years straight to get back to the old unemployment level.
Zero Hedge is correct, but let's investigate why that is so.
Conditions Have Changed
Common sense suggests that if you are going to model data and make predictions based on previous events, current conditions need to be the same as, or at least similar to prior conditions.
Every one of those curves represents a typical economic slowdown, not a consumer-led credit and housing implosion the likes of which has not been seen since the great depression. Thus, the San Francisco Fed's conclusion is as likely to be correct as concluding a robust housing rebound is likely to start any time based on analysis of housing charts from prior recessions.
Well a housing rebound is not likely, and if it's not, neither is a hiring spree, nor a rebound in commercial real estate nor any other meaningful increase in jobs.
In short, the study is invalid because conditions have changed. No one has modeled a credit crunch or a housing bust because we have not seen one since the Great Depression.
Structurally High Unemployment For A Decade
I am not an economist, nor do I place any current relevance in prior Beveridge curves, nor do I think it makes sense to model this recession compared to any other recent recession.
I believe that is to my advantage when I made the claim on August 18, 2009 of Structurally High Unemployment For A Decade
Harsh Reality From Bernanke
In the Incredible Shrinking Boomer Economy I noted a harsh reality quote of Bernanke:
"It takes GDP growth of about 2.5 percent to keep the jobless rate constant. But the Fed expects growth of only about 1 percent in the last six months of the year. So that's not enough to bring down the unemployment rate."
Pray tell what happens if GDP can't exceed 2.5% for a couple of years? What about a decade (or on and off for a decade)?
If you have come to the conclusion that we are going to have structurally high unemployment for a decade, you have come to the right conclusion.Fed Projects 2012 Unemployment 6.1-7.6%
Flashback December 7, 2009: Fed's Unemployment Projections From Mars
Fed's 2012 Forecast
Let's start with a look at the Fed's 2012 forecast where the band is 6.1% to 7.6%.
Using Bernanke's estimate that it takes 100,000 jobs a month to keep up with birthrate and demographics, the economy will have to create 260,000 jobs every month in 2010, 2011, and 2012 to hit an unemployment rate of 6.17% by the end of 2012.
To get to 7.6% by the end of 2012, the economy would have to average 200,000 jobs a month for the next three years.
2000-2009 Perspective
- At the height of the internet bubble with a nonsensical Y2K scare on top of that, the economy managed to gain 264,000 jobs a month.
- At the height of the housing bubble in 2005, the economy added 212,000 jobs a month.
- At the height of the commercial real estate bubble with massive store expansion, the economy added somewhere between 96,000 and 178,000 jobs per month depending on where you mark the peak.
Neither the housing boom, nor the commercial real estate boom is coming back. Nor is there going to be another internet revolution. If anything, outsourcing of internet jobs to Asia is likely to remain intense.
No Genuine Driver For Jobs.
- The retail sector has massive overcapacity. We do not need more Home Depots, WalMarts, Lowes, Sears, Pizza Huts, Targets, Safeways, etc etc.
- Commercial real estate is flooded with vacant offices and plagued by falling rents.
- Housing inventory is enormous.
- Boomers will be looking to downsize their lifestyles.
- There is not going to be another internet boom.
It is well beyond absurd to expect the economy to average even 200,000 jobs a month, let alone 260,000 jobs a month when neither the housing boom nor the commercial real estate boom could manage those numbers over a sustained period.
In short, the Fed's unemployment projections must be for some other planet or for some other alternate universe somewhere because they do not reflect reality here.
Beveridge Curve Analysis vs. Common Sense
I did not need an analysis of Beveridge curves to trash the Fed's forecast. All I used was a bit of common sense.
You can certainly kiss 6.1% by the end of 2012 goodbye. It is highly likely you can kiss 7.6% by the end of 1012 goodbye as well.
Moreover, I do not think the top in unemployment rate is in. The only reason unemployment is not above 10% right now is the participation rate has been plunging like a rock (people have been dropping out of the workforce).
Heaven help us if the economy slows further, even if it does not technically double-dip.
The bottom line is simple: There is still no driver for jobs, there is little likelihood of a driver for jobs, and reliance on academic wonks for economic forecasts is fraught with error.
Common sense will triumph over academic formulas, 8 days a week.
By Mike "Mish" Shedlock
http://globaleconomicanalysis.blogspot.com
Click Here To Scroll Thru My Recent Post ListMike Shedlock / Mish is a registered investment advisor representative for SitkaPacific Capital Management . Sitka Pacific is an asset management firm whose goal is strong performance and low volatility, regardless of market direction.
Visit Sitka Pacific's Account Management Page to learn more about wealth management and capital preservation strategies of Sitka Pacific.
I do weekly podcasts every Thursday on HoweStreet and a brief 7 minute segment on Saturday on CKNW AM 980 in Vancouver.
When not writing about stocks or the economy I spends a great deal of time on photography and in the garden. I have over 80 magazine and book cover credits. Some of my Wisconsin and gardening images can be seen at MichaelShedlock.com .
© 2010 Mike Shedlock, All Rights Reserved.
© 2005-2022 http://www.MarketOracle.co.uk - The Market Oracle is a FREE Daily Financial Markets Analysis & Forecasting online publication.