Dollar Breakdown, America Has Lost its Imagination, Its Population Brainwashed to Do the Elites Bidding
Politics / US Politics Nov 08, 2010 - 03:39 PM GMTBy: Anthony_J_Stills
 “Imagination has brought mankind through the dark ages to its present state of civilization. Imagination led Columbus to discover America. Imagination led Franklin to discover electricity.” -L. Frank Baum
In my opinion America has lost its imagination. The populace has been brainwashed into letting a select group of individuals do all the thinking for them. In the best of all possible worlds it will produce a population that is dull and capable of only doing menial tasks for a menial wage, even if the people in charge have the best of intentions.
The people in charge of the United States do not have the best intentions of the majority in mind. Their goal is to transfer the wealth of the many into the pockets of the few and that is leading to the internal decay of a once great nation. Signs of this decay are everywhere and I would like you to focus your attention on a list put together by the well-known analyst, Peter Grandich, that includes 24 statistics about the United States economy that are almost too embarrassing to admit to:
#1 Ten years ago, the United States was ranked number one in average wealth per adult. In 2010, the United States has fallen to seventh.
#2 The United States once had the highest proportion of young adults with post-secondary degrees in the world. Today, the U.S. has fallen to 12th.
#3 In the 2009 “prosperity index” published by the Legatum Institute, the United States was ranked as just the ninth most prosperous country in the world. That was down five places from 2008.
#4 In 2001, the United States ranked fourth in the world in per capita broadband Internet use. Today it ranks 15th.
#5 The economy of India is projected to become larger than the U.S. economy by the year 2050.
#6 One prominent economist now says that the Chinese economy will be three times larger than the U.S. economy by the year 2040.
#7 According to a new study conducted by Thompson Reuters, China could become the global leader in patent filings by next year.
#8 The United States has lost approximately 42,400 factories since 2001. Approximately 75 percent of those factories employed at least 500 workers while they were still in operation.
#9 The United States has lost a staggering 32 percent of its manufacturing jobs since the year 2000.
#10 Manufacturing employment in the U.S. computer industry is actually lower in 2010 than it was in 1975.
#11 In 1959, manufacturing represented 28 percent of all U.S. economic output. In 2008, it represented only 11.5 percent.
#12 The television manufacturing industry began in the United States. So how many televisions are manufactured in the United States today? According to Princeton University economist Alan S. Blinder, the grand total is zero.
#13 As of the end of 2009, less than 12 million Americans worked in manufacturing. The last time that less than 12 million Americans were employed in manufacturing was in 1941.
#14 Back in 1980, the United States imported approximately 37 percent of the oil that we use. Now we import nearly 60 percent of the oil that we use.
#15 The U.S. trade deficit is running about 40 or 50 billion dollars a month in 2010. That means that by the end of the year approximately half a trillion dollars (or more) will have left the United States for good.
#16 Between 2000 and 2009, America’s trade deficit with China increased nearly 300 percent.
#17 Today, the United States spends approximately $3.90 on Chinese goods for every $1 that China spends on goods from the United States.
#18 According to a new study conducted by the Economic Policy Institute, if the U.S. trade deficit with China continues to increase at its current rate, the U.S. economy will lose over half a million jobs this year alone.
#19 American 15-year-olds do not even rank in the top half of all advanced nations when it comes to math or science literacy.
#20 Median household income in the U.S. declined from $51,726 in 2008 to $50,221 in 2009. That was the second yearly decline in a row.
#21 The United States has the third worst poverty rate among the advanced nations tracked by the Organization for Economic Cooperation and Development.
#22 Since the Federal Reserve was created in 1913, the U.S. dollar has lost over 95 percent of its purchasing power.
#23 U.S. government spending as a percentage of GDP is now up to approximately 36 percent.
#24 The Congressional Budget Office is projecting that U.S. government public debt will hit 716 percent of GDP by the year 2080.
Enough said!
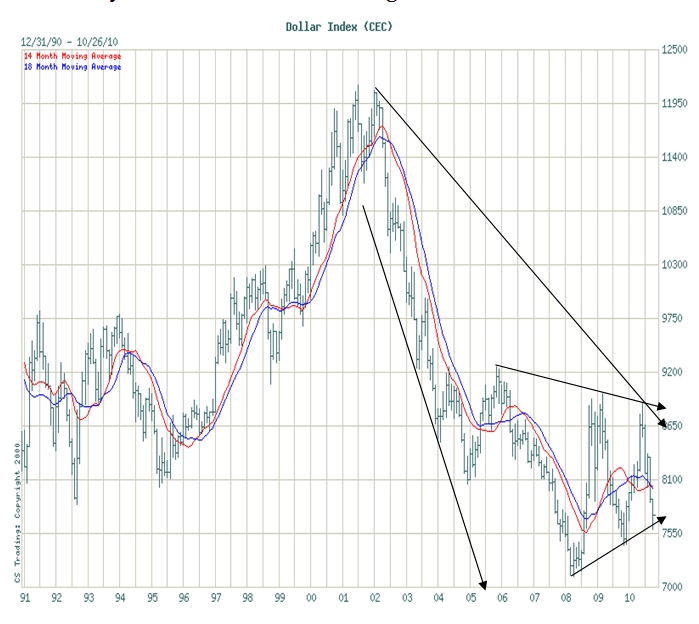
Whenever a country, any country, begins to rot from within you’ll see that rot reflected in the performance of its currency. The US has been decaying for several decades but it was not immediately reflected in the dollar’s behavior due to the fact that it enjoyed a special status as the world’s reserve currency. That is no longer the case. The US dollar has been in decline now for just over a decade as you can see in the following historical chart:

I don’t think it’s any coincidence that the top came with the initial phase of Bush’s “nation building” and Greenspan’s determined effort to blow bubbles. All great leaders know that building begins at home!
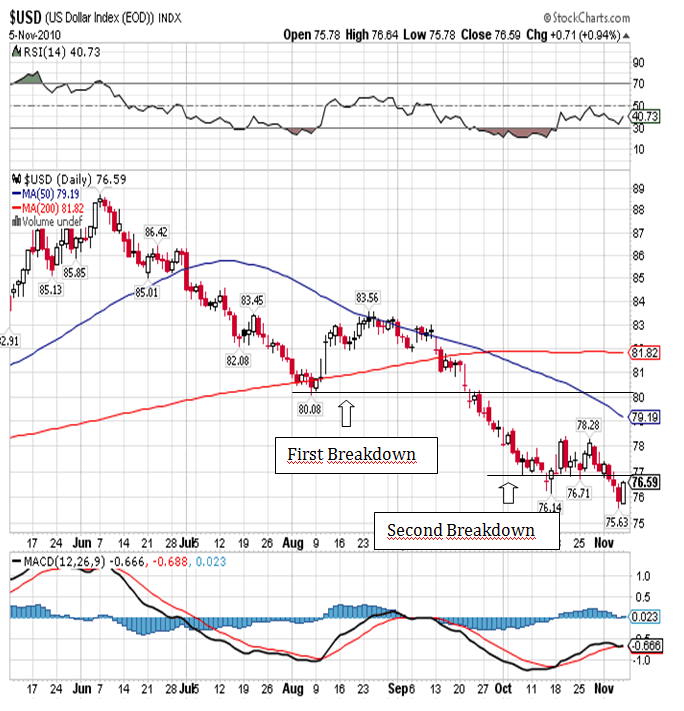
Recently the US dollar tested the bottom band of a trend line that stretches all the way back to the 2008 low of 70.70, and it then experienced a bounce. That bounce has taken the dollar back up to just above the 76.98 mark that offered so much support, and that is not unusual behavior. As you can see in the six-month daily chart below, this is the second such break down in the last three months:

The US dollar broke strong support at 80.16 in September and never stopped until it bounced off of what had been strong support at 76.98. It failed to hold and as I type the US dollar is trading up .35 at 76.95 and this is the second day off of the Thursday low at 75.65. I would look for a higher high tomorrow and then the dollar should turn back down and test the bottom band originating from the 2008 low. That band corresponds nicely to good Fibonacci support at 75.01 and I would be surprised to see it hold this time around.
A number of foreign countries have expressed discontent at the Fed’s announced quantitative easing amounting to a US $600 billion printing fest all at your expense. As I stated earlier the US lacks imagination and the Fed’s insistence at using the same failed formula time and again is the best example of unimaginative policy making I can think of. Serious problems almost always require serious solutions, along with sacrifice and pain. We’d rather lose ourselves watching reality TV than think about real issues. Imagination might require that one eliminate the IRS and put a consumption tax in its place. It might also require a true balanced budget and a serious cutback in defense spending. The present crop of politicians are all for cuts, as long as you don’t touch their respective pork. Cuts the other guy’s pork, but don’t touch mine. That’s why we’re where we are at, and that’s why things will only get worse from here on out.
Just four short months ago analysts were projecting a dollar rally that would take the Index up to 100.00 or more, but you don’t hear anything from them anymore. You also don’t hear anything with respect to the decay in real purchasing power of the greenback, roughly equal to 1% for each year the Fed has been in existence. That’s by design but you’re not supposed to know that. In the old days they used to campaign on the slogan “two chickens in every pot”. Now the hidden agenda is 1,000 channels worthless of cable TV and an X-box in every house in order to drain every ounce of creativity out of you. God forbid that you could ever be capable of an original thought. Not on Obama’s watch, and certainly not with Bernanke manning the printing press.Anthony J. Stills
analyst@theablespeculator.com
© 2010 Copyright Anthony J. Stills - All Rights Reserved
Disclaimer: The above is a matter of opinion provided for general information purposes only and is not intended as investment advice. Information and analysis above are derived from sources and utilising methods believed to be reliable, but we cannot accept responsibility for any losses you may incur as a result of this analysis. Individuals should consult with their personal financial advisors.
© 2005-2022 http://www.MarketOracle.co.uk - The Market Oracle is a FREE Daily Financial Markets Analysis & Forecasting online publication.


