Seven Bullish U.S. Dollar Charts You Should See
Currencies / US Dollar Nov 06, 2010 - 12:19 PM GMTBy: Bryan_Rich
 The currency market, as well as all markets, have been heavily focused on the U.S. and the Fed’s plans for more quantitative easing (QE).
And that’s had a huge impact on the dollar and on dollar sentiment.
The question is: Will it last?
There’s no disputing that the dollar is the key to making this “reflation trade” tick. However, there is much dispute over whether the Fed’s QE2 plans will work … whether the strategy will produce demand, thus inflation, and whether it will have a sustainably devaluing effect on the dollar.
Despite all of the mania surrounding the dollar in recent months, history suggests from the Fed’s last adventure with QE, that none of aforementioned desired economic outcomes will ultimately pan out from QE2. Nor will it affect a draconian outcome for the dollar!
For a big picture perspective let’s take a look at seven key charts to see what may be in store for the dollar after the QE buzz has faded.
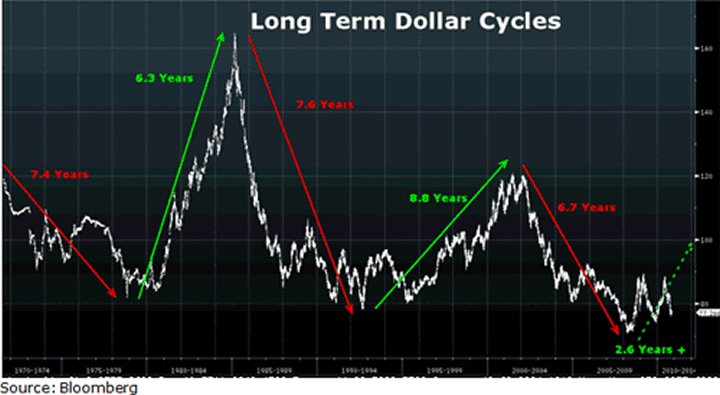
Chart #1: Long-term dollar cycles
You can see in the chart below the roughly seven-year cycles in the dollar, dating back to the failure of the Bretton Woods system 40 years ago. These cycles argue that a bull cycle in the dollar started in March 2008.
|
That would put the dollar just 2.6 years into its new bull cycle or a bit more than a third of the way through a typical long-term dollar cycle.
Without question, this recent cycle has been very volatile. But the buck continues to trade comfortably above its 2008 all-time lows and the lows of last year, making higher lows along the way — a bullish pattern.
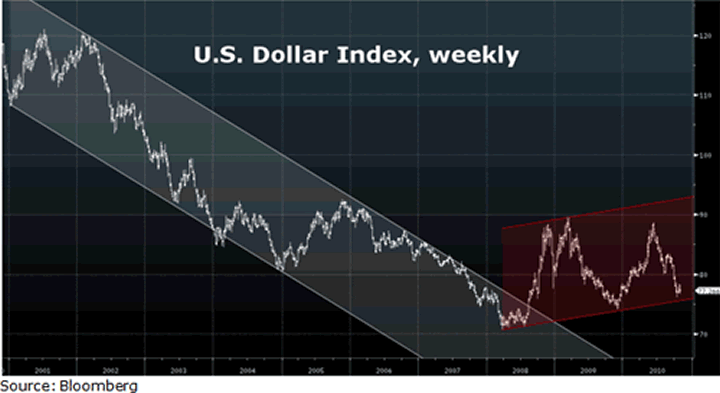
Chart #2: 10-year dollar chart
The chart below shows the roughly seven-year downtrend in the dollar and the subsequent ascending channel that started in 2008. You can see that the dollar is now testing the bottom line of this bull channel, an attractive area to buy the greenback.
|
A bounce from these levels would project a move toward the top line of the channel or about 23 percent higher.
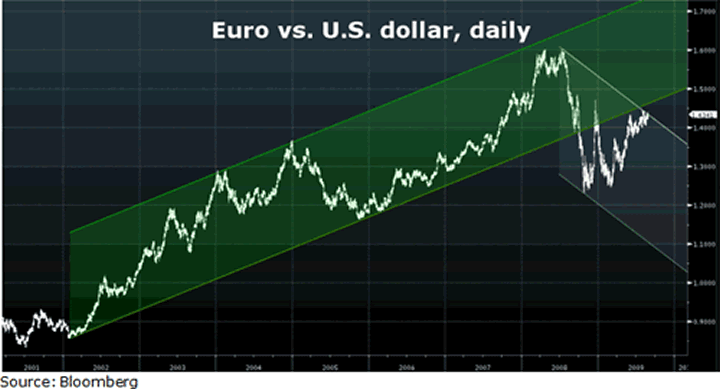
Chart #3: 10-year euro chart
This chart for the euro is essentially the inverse of the dollar. And here too, you can see a long multi-year trend, higher in the case of the euro, followed by a descending channel.
|
The euro also is bumping into a technical boundary, one that represents a downward trending channel. A fall from this level of resistance would open up a downside for the euro that would be right on target with most bearish estimates espoused when the euro zone was at the height of its crisis … parity versus the dollar.
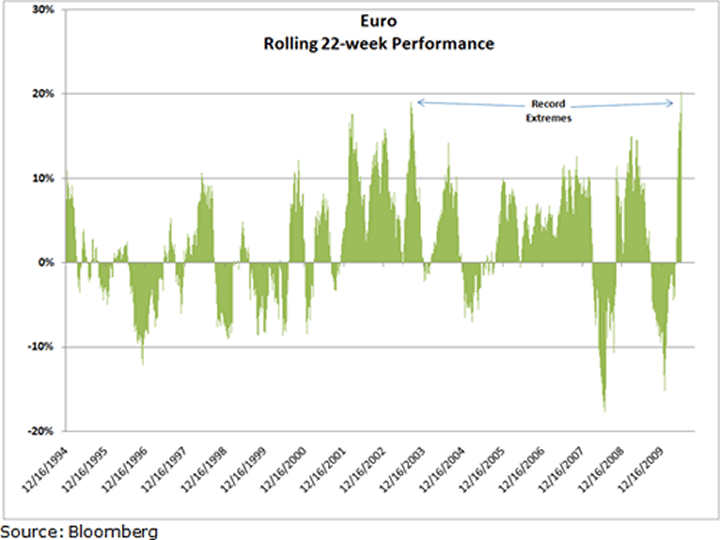
Chart #4: Euro’s 22-week run
For more on the euro, consider this: The euro is in the midst of its strongest 22-week run on record, surpassing its prior record surge in 2003 — both areas are noted in the chart below.
|
What’s notable here is that in 2003, a 9 percent correction abruptly followed this strong climb. From current levels in the euro, a similar correction would mean a move down to 1.30 over the next few months.
Chart #5: Pound still weak
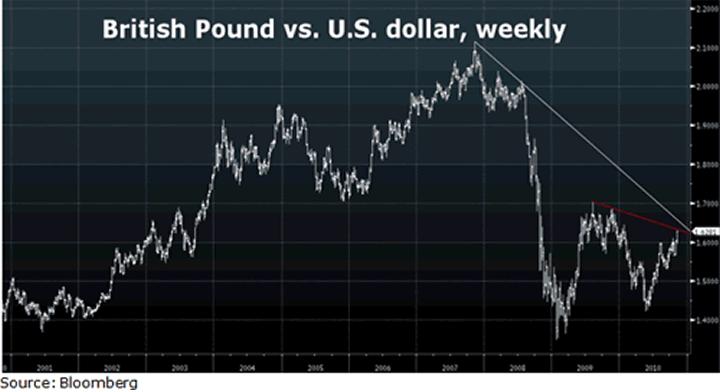
Despite all of the fuss over the weak dollar, the British pound is still trading nearly 25 percent weaker against the dollar since the onset of the financial crisis three years ago.
|
And in the chart above, you can see that while the dollar and the euro are bumping into critical long-term technical areas, so is the pound.
Chart #6: Yen near all-time highs
Now, for the Japanese yen, the other remaining major currency in the world …
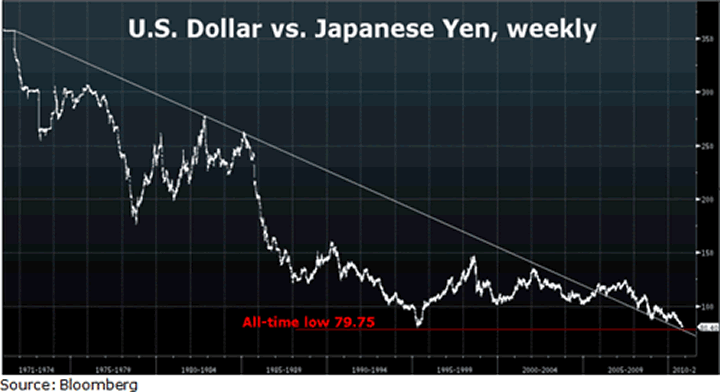
This long-term chart in dollar/yen going back 40-years since the failure of the Bretton Woods system, shows its steady decline.
Even given its recent intervention the pair is nearing all-time lows (lows in the dollar, highs in the yen). From this chart, compared to the charts of the euro and the pound, you can see the lion’s share of dollar weakness over the past few years has come from the surging yen.
|
And now as this dollar/yen exchange rate nears all-time lows, the Bank of Japan is rolling out its most aggressive deflation-fighting act yet: With more QE, more fiscal policy and a cut in what’s left of its interest rate.
Plus, the Bank of Japan is officially in intervention mode — all things that make a case for a bounce in dollar/yen.
Finally …
Chart #7: Battle against the yuan
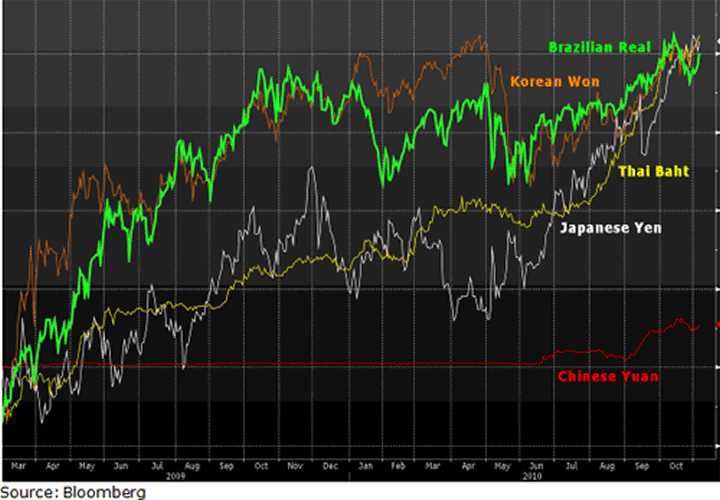
With the Fed’s QE2 policy officially on the table, the emerging market and Asian countries that have been waging a fight to keep their currencies from a runaway surge have already stepped up with more currency market intervention and talks of capital controls.
|
And they are doing so because the dollar is weakening. But more importantly they’re reacting because the Chinese yuan is getting weaker relative to their currencies in the process — a competitive disadvantage for their export trade.
The key take-away: A grossly weaker dollar is not an economically or politically acceptable proposition for the world. And trouble for the world economy represents trouble for the U.S. economy.
So, despite all of the bold projections of a continued rout in the dollar, these seven charts suggest the exact opposite outcome could be around the corner.
Regards,
Bryan
P.S. This week on Money and Markets TV, our analysts took a look at the third quarter’s strong corporate earnings and discussed what’s ahead for the fourth quarter and beyond. If you missed Thursday night’s episode or would like to see it again at your convenience — it is now available at www.weissmoneynetwork.com.
This investment news is brought to you by Money and Markets. Money and Markets is a free daily investment newsletter from Martin D. Weiss and Weiss Research analysts offering the latest investing news and financial insights for the stock market, including tips and advice on investing in gold, energy and oil. Dr. Weiss is a leader in the fields of investing, interest rates, financial safety and economic forecasting. To view archives or subscribe, visit http://www.moneyandmarkets.com.
© 2005-2022 http://www.MarketOracle.co.uk - The Market Oracle is a FREE Daily Financial Markets Analysis & Forecasting online publication.


