QE2 Is Likely to More Successful than QE1
Interest-Rates / Quantitative Easing Nov 04, 2010 - 02:35 PM GMTBy: Paul_L_Kasriel
 On November 3, the FOMC announced that it would increase the quantity of its outright holdings of securities by a net $600 billion by the end of the second quarter of 2011. Thus, the Fed has re-embarked on a policy of quantitative easing. Its first real "voyage" of quantitative easing, QE1, started at the end of November 2008 and ended in March 2010. The expected (hoped for?) outcome of a quantitative -easing policy is increased nominal demand for goods and services. Under normal circumstances when the commercial banking system is not constrained by actual or expected capital inadequacy, the Fed is able to stimulate the nominal demand for goods and services by lowering its key policy interest rate, the federal funds rate.
The federal funds rate is the one-day cost of immediately available funds in the financial system and, therefore, represents the marginal cost at which banks can fund themselves. As banks' cost of funds goes down, due to competition, banks pass on their lower cost of funds to their loan customers. The decline in loan rates leads to an increase in the quantity demanded of bank credit. The increase in bank credit supplied leads to increased nominal spending on goods, services and assets. When the banking system is constrained by actual or expected capital inadequacy, banks collectively are unable to increase their supply of credit even though their marginal cost of funds has fallen. This actual or expected banking- system capital inadequacy has been hampering the effectiveness of the Fed's low interest-rate policy in stimulating the nominal demand for goods, services and assets. Thus, the Fed is now turning to a second round of quantitative easing.
There has been much misinterpretation in the media of how quantitative easing "works." Indeed, we are not sure that even the Federal Reserve fully understands how quantitative easing works. The typical explanation of how quantitative easing works is that the Fed's purchases of longer-maturity securities will bring down the interest rates on these securities. The lower interest rates on longer-maturity securities will then induce the nonbank private sector to borrow and spend more. Also, the lower interest rates on longer-maturity securities will make equities more attractive investments at the margin, thereby causing a really in equity prices, which, in turn, will induce the private sector to increase its current spending on goods and services via a wealth effect.
Lastly, the lower interest rates on longer-maturity securities and the expectation that the Fed will hold short-term interest rates at a very low level for a extended period of time will weaken the foreign -exchange value of the dollar, thereby making U.S. exports more price competitive in global markets. All else the same, we do not dispute that interest rates on longer-maturity securities would fall, that equities would become more attractive and that the foreign-exchange value of the dollar would decline with the implementation of quantitative easing on the part of the Fed. What we do dispute is that these are the main channels through which quantitative easing operates to stimulate the nominal demand for goods, services and assets.
Have you noticed by now that whenever we mention quantitative easing, we italicize quantitative? We have done this to emphasize that the main channel through which quantitative easing stimulates the nominal demand for goods, services and assets is through the quantity of credit created by the combined Federal Reserve System and commercial banking system, not the price of credit (the interest rate), not the price of equities and not the price of foreign exchange. If one were to review Econ 101 text books, one would discover that central banks are able to create credit figuratively "out of thin air." The important implication of this is that the recipients of central bank-created credit are able to purchase goods, services and assets without any other entity in the economy having to cut back on its current purchases of goods, services and assets.
The Federal Reserve, of course, is the U.S. central bank. If one were to read a little further in the Econ 101 text, one would discover that the commercial banking system, not an individual bank, also is able to create credit figuratively "out of thin air,"providing that the central bank supplies the "seed money" for this to the commercial banking system. The important implication of the creation of credit by the commercial banking system, is the same as that of the creation of credit by the central bank: the recipients of this credit created by the commercial banking system are able to purchase goods, services and assets without any other entity in the economy having to cut back on its current spending on goods, services and assets. Thus, if combined central bank and commercial banking system credit increases, there is a presumption that current nominal aggregate spending on goods, services and assets will increase. That same presumption with regard to an increase in nominal aggregate spending cannot be made when credit is granted by the nonbank sector. In this case, the presumption is that the grantors of credit will decrease their current nominal spending, transferring purchasing power to the recipients of the credit. Thus, when the nonbank sector extends credit, the presumption is that nominal aggregate spending does not increase. The exception to this presumption would occur if the quantity of currency and bank liabilities desired to be held by the nonbank public were to fall by an amount equal to or greater than the amount of nonbank credit extended.
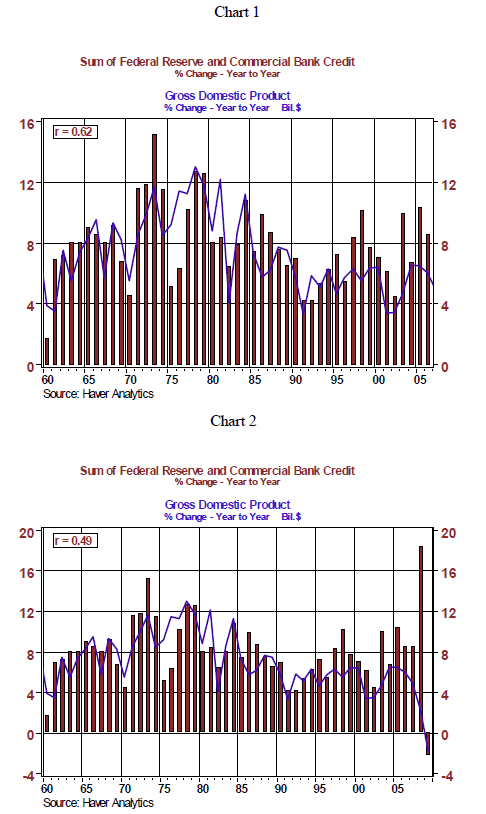
To reiterate, the logic or theory of quantitative (we have stopped italicizing it now) easing is that an increase in the quantity of combined central bank and commercial banking system credit will lead to an increase in nominal aggregate spending on goods, services and assets. Chart 1 shows that the correlation coefficient between percentage changes in the annual average of combined Federal Reserve and commercial banking system credit and the percentage changes in nominal U.S. GDP from 1960 through 2006 is relatively high at 0.62. (A perfect correlation between the two series would be represented by a correlation coefficient of 1.00). Chart 2 demonstrates that this correlation coefficient is reduced to 0.49 when the period is extended through 2009. In 2008, there was a large percentage increase in combined Federal Reserve and commercial banking system credit but a reduction in the percentage change in nominal GDP. We believe that a significant amount of this increased Fed-commercial bank credit was acquired to build up "cash" holdings for precautionary reasons due to the turmoil in the financial markets.
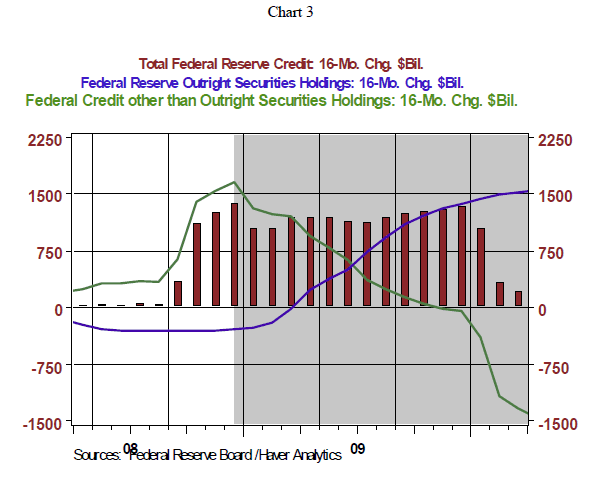
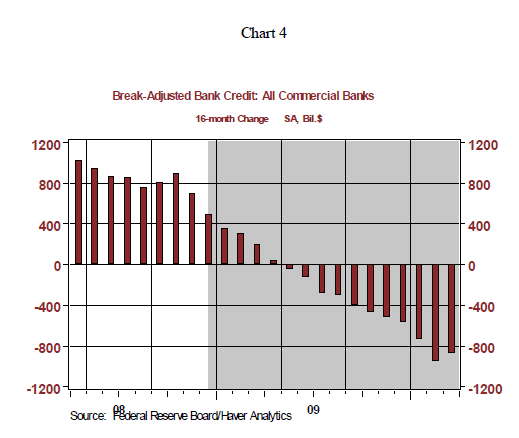
Now, let us examine what happened to combined Federal Reserve and commercial banking system during the Fed's first round of quantitative easing that covered the 16 months ended March 2010. Chart 3 shows the net change in total Federal Reserve credit, Federal Reserve outright holdings of securities and Federal Reserve credit excluding outright holdings of securities in the 16 months ended March 2010 (the shaded area in the chart). Notice that although Federal Reserve outright holdings of securities increased a net $1.5 trillion during the first round of Fed quantitative easing, total Federal Reserve credit increased by only a net $200 billion during this period because other elements of Federal Reserve credit contracted by a net $1.3 trillion. Chart 4 shows that commercial banking system credit contracted by a net $875 billion in the 16 months of the Fed's first round of quantitative easing. Thus, when we sum the net change in Federal Reserve credit and commercial banking system credit in the 16 months ended March 2010, the period encompassing the Fed's first round of quantitative easing, we find that the net change in credit was minus $675 billion. Is it any wonder, then, why the response of nominal GDP growth was so restrained to QE1? We would argue that QE1 was a misnomer in that there was no quantitative easing, but rather a quantitative contraction.
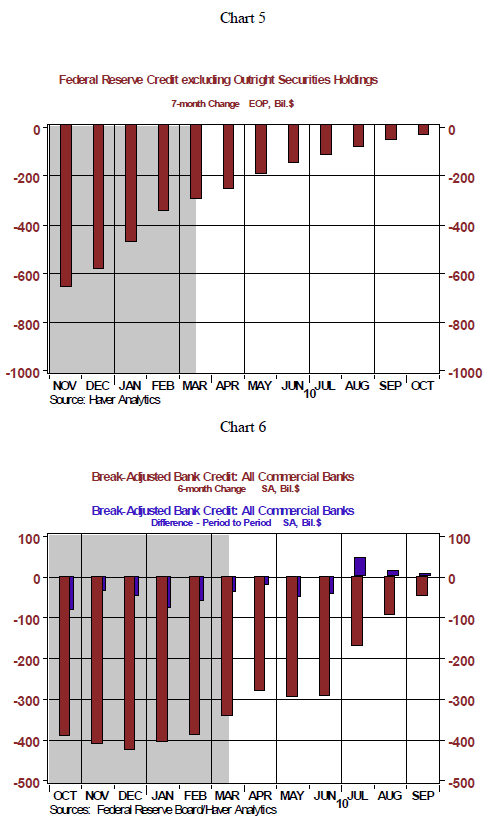
What is the prospect that the Fed's second round of quantitative easing will not be a misnomer, that is, it will result in a net increase in combined Federal Reserve and commercial banking system credit? Chart 5 shows that in the seven months since the end of QE1, the rate of contraction in other elements of Federal Reserve credit besides outright securities holdings has slowed significantly. In the seven months ended October 2010, these other elements of Federal Reserve credit have contracted by only a net $36 billion. If these other elements of Fed credit continue to contract by only a small amount or stabilize, then the Fed's planned $600 billion net increase in its outright securities holdings will make almost a dollar-for-dollar increase in total Federal Reserve credit. Chart 6 shows the behavior of commercial banking system credit since the end of QE1 through September 2010, the latest full monthly data available. In the six months ended September 2010, commercial banking system credit contracted by only $47 billion. In each of three months ended September 2010, commercial banking system credit increased.
The latest Federal Reserve survey of bank lending practices, which covered the three months ended July 2010, showed a significant increase in the percentage of respondent banks easing their lending standards. The actual recent behavior of commercial banking system credit and the results of the recent Federal Reserve survey of bank lending practices suggest that commercial banking system credit will be a considerably smaller drag on combined Federal Reserve and commercial banking system credit creation or perhaps make a small positive contribution during the second round of Federal Reserve quantitative easing.
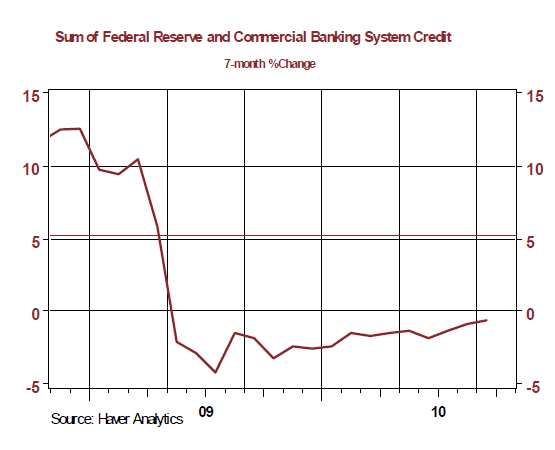
For the sake of argument, let us assume that in the next seven months combined Federal Reserve and commercial banking system credit increase a net $600 billion, the amount of the Fed's planned securities purchases over this period. This would represent a 5.2% increase in the September level of combined Federal Reserve and commercial banking system credit. Chart 7 shows that there has not been a seven-month increase in this credit aggregate of 5.2% or greater since March 2009. Now, a 5.2% increase in combined Federal Reserve and commercial banking system credit is unlikely to result in a boom in nominal aggregate demand, but it will help prevent the economy from slipping back into a recession within the next 12 months in the face of substantial economic headwinds emanating from the housing and state/local government sectors of the U.S. economy.
There appears to be some concern by foreign monetary authorities that QE2 will result in the Federal Reserve "exporting"some U.S. inflation to their economies. This could occur if foreign central banks peg their currencies to the U.S. dollar. If QE2 puts downward pressure on the foreign-exchange value of the dollar and foreign central banks purchase dollars in the open market in order to prevent an appreciation in their home-country currencies, paying for these dollars by issuing their own currencies, then, indeed, foreign central banks could be "importing" increased inflation. But foreign central banks are not obligated to do this. They could accept an appreciation in their currencies vs. the dollar. Would this have an adverse effect on exports to the U.S. of economies whose currencies are appreciating? At the margin it would. But overall exports to the U.S. from these economies might remain the same or even increase as the negative foreign-exchange effect, or price effect, might be more than offset by the "income"effect in the U.S. emanating from QE2. That is, QE2 would be expected to increase the nominal demand for goods and services, some of which would be imported goods and services.
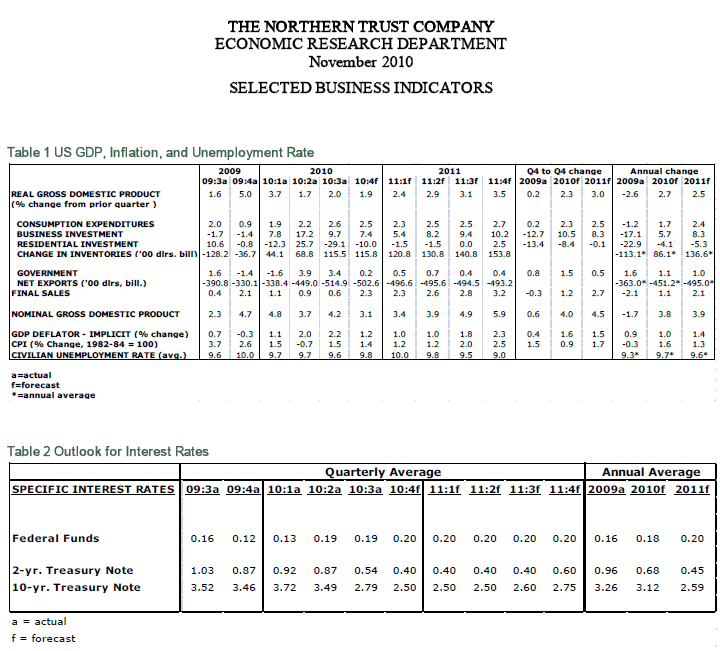
We have not published an economic/interest rate forecast update since August due to no meaningful change in our outlook and due to an extremely heavy travel schedule. We apologize for this "silence"to any clients and partners who missed our updates. Since our August publication, we have reduced marginally our 2011 real GDP growth forecast from 3.2% on a Q4/Q4 basis to 3.0%. The reduction is primarily due to a reduction in our 2011 growth forecasts in the categories of residential investment expenditures and state/local government spending. Despite the downward adjustments to these categories, we believe that stronger real GDP growth can be achieved in 2011 compared with 2010 and some modest reduction in the unemployment rate can occur in 2011 with the small but positive growth in commercial bank credit that we anticipate and the increase in Federal Reserve credit as a result of QE2. We also have pushed back into early 2012 our forecast of the first Federal Reserve interest rate increase. Even if QE2 were to end in the second quarter of 2011, and there is no guarantee that it will end at this time, the FOMC is unlikely to begin raising its policy interest rates - the federal funds rate and the interest rate it pays on banks' excess reserves - immediately after the end of QE2.
Paul L. Kasriel
Asha G. Bangalore
Paul Kasriel is the recipient of the 2006 Lawrence R. Klein Award for Blue Chip Forecasting Accuracy
by Paul Kasriel
The Northern Trust Company
Economic Research Department - Daily Global Commentary
Copyright © 2010 Paul Kasriel
Paul joined the economic research unit of The Northern Trust Company in 1986 as Vice President and Economist, being named Senior Vice President and Director of Economic Research in 2000. His economic and interest rate forecasts are used both internally and by clients. The accuracy of the Economic Research Department's forecasts has consistently been highly-ranked in the Blue Chip survey of about 50 forecasters over the years. To that point, Paul received the prestigious 2006 Lawrence R. Klein Award for having the most accurate economic forecast among the Blue Chip survey participants for the years 2002 through 2005.
The opinions expressed herein are those of the author and do not necessarily represent the views of The Northern Trust Company. The Northern Trust Company does not warrant the accuracy or completeness of information contained herein, such information is subject to change and is not intended to influence your investment decisions.
Paul L. Kasriel Archive |
© 2005-2022 http://www.MarketOracle.co.uk - The Market Oracle is a FREE Daily Financial Markets Analysis & Forecasting online publication.


