


Numerology Forecasts For Gold, Silver, HUI, Crude Oil and USD
Commodities / Commodities Trading Nov 03, 2010 - 05:32 PM GMTBy: I_M_Vronsky

 Price Objectives per The Rule of Seven
There appears to be no rhyme nor reason to The Rule of Seven (*), which was first described in detail in the book, "TECHNIQUES OF A PROFESSIONAL COMMODITY CHART ANALYST."
Across the years I have found this technique often surprisingly accurate in its predictions. It is based on the assumption that the initial leg of a new price trend reflects the potential power of the changing forces of supply and demand sufficiently to serve as a guide to the probable extent of the price move. Put another way, using the Rule of Seven, a measurement of the initial leg of the trend is all the information needed to project one or more objectives in the direction of the new trend.
The basic formula is: Measure the size of the initial up-leg by subtracting the low price from the high; multiply that figure by seven; then divide the product by four to get the distance from the low to the first (price) objective. For the next two price targets, divide the product by three for the second objective, and finally by two for the third objective. Note that for each of the three objectives the respective distance figure is added to the low.
The Rule of Seven�2010 APPLIED TO GOLD
Gold chart shows initial leg was from 2001 ($256) to Jan2008 ($985):
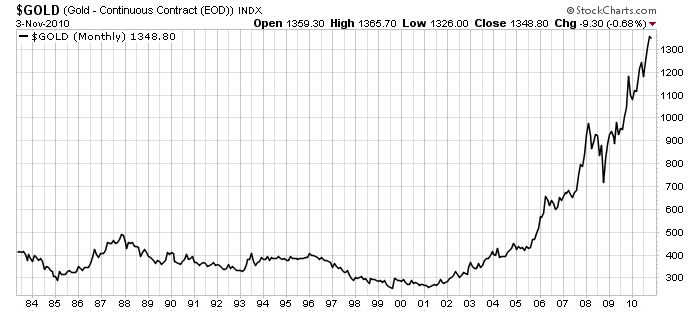
Initial First Leg = 985 - 256 = 729 1st price objective is calculated 729 x 7 = 5103 And 5103/4 = 1276 Therefore 1st price objective is: 256 + 1276 >>> $1532
********
2cd price objective is calculated 5103/3 = 1701 Therefore 2cd price objective is: 256 + 1701 >>> $1957
********
3rd price objective is calculated 5103/2 = 2551 Therefore 3rd price objective is: 256 + 2551 >>> $2907
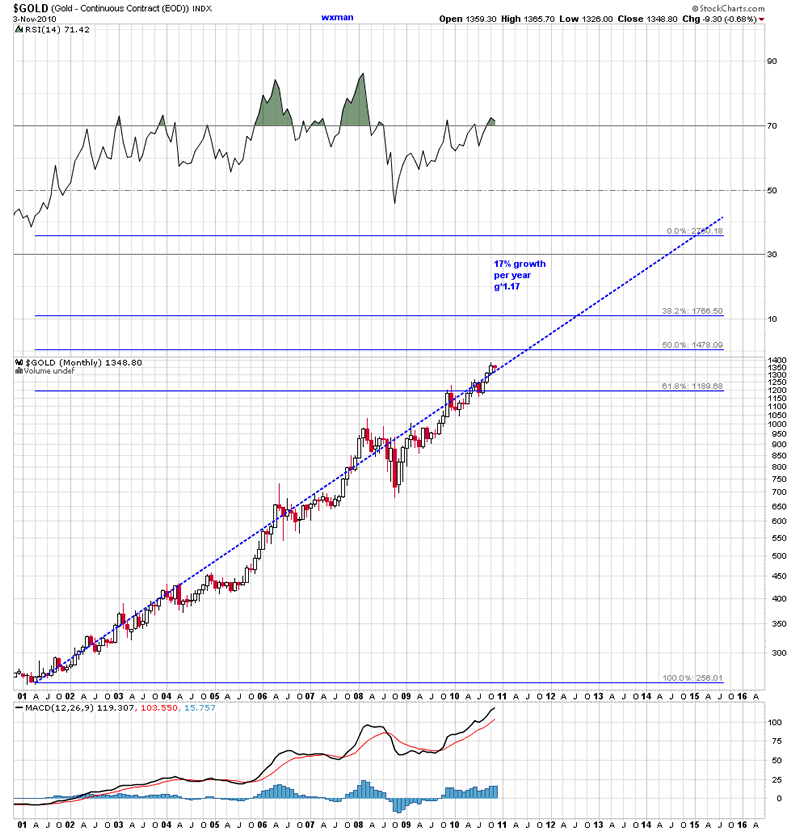
An estimate time frame for gold to reach the three price objectives might be inferred from gold's historical 17% price growth. The chart below shows we might reach $1532 in 2011, $1957 in 2013 and $2907 sometime in 2015.
Please be cautioned, THIS IS NOT A RECOMMENDATION TO BUY OR SELL ANY FORM OF GOLD. I am merely sharing my research reading with you. But by all means go to a library to read this book, which provides many other little known TA methods. Who knows, old TA methods may be like old neckties, if one waits long enough the style comes back.
********
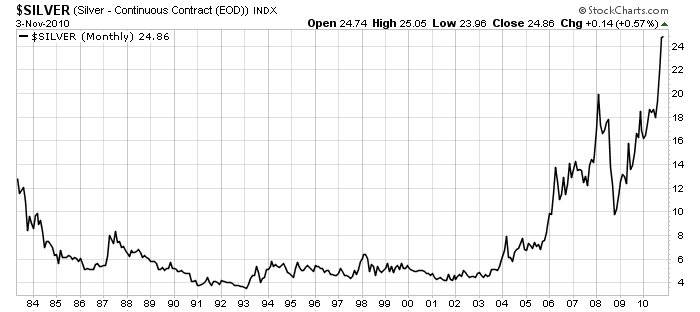
The Rule of Seven 2010 APPLIED TO SILVER
Silver chart shows initial leg was from 2001 ($4) to Jan2008 ($20):
********
Initial First Leg = 20 - 4 = 16 1st price objective is calculated 16 x 7 = 112 And 112/4 = 28 Therefore 1st price objective is: 4 + 28 >>> $32
********
2cd price objective is calculated 112/3 = 37.33 Therefore 2cd price objective is: 4 + 37.33 >>> $41
********
3rd price objective is calculated 112/2 = 56 Therefore 3rd price objective is: 4 + 56 >>> $60
********
An estimate time frame for silver to reach the three price objectives might be approximately the same as for gold to reach its three price objectives (per the Rule of Seven). Specifically. silver might reach $32 in 2011, $41 in 2013 and $60 sometime in 2015.
Please be cautioned, THIS IS NOT A RECOMMENDATION TO BUY OR SELL ANY FORM OF SILVER.
********
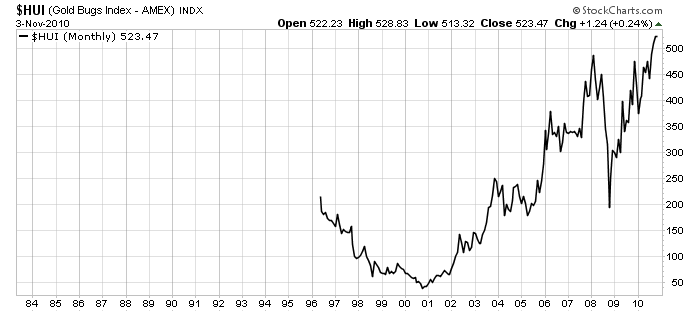
The Rule of Seven 2010 APPLIED TO HUI
HUI's chart shows initial leg was from 2001 (50) to Jan2008 (480):
********
Initial First Leg = 480 - 50 = 430 1st price objective is calculated 430 x 7 = 3011 And 3011/4 = 753 Therefore 1st price objective is: 50 + 753>>> 803
********
2cd price objective is calculated 3011/3 = 1004 Therefore 2cd price objective is: 50 + 1004 >>> 1054
********
3rd price objective is calculated 3011/2 = 1505 Therefore 3rd price objective is: 50 + 1505 >>> 1555
********
An estimate time frame for HUI to reach the three price objectives might be approximately the same as for gold to reach its three price objectives (per the Rule of Seven). Specifically. HUI might reach 803 in 2011, 1054 in 2013 and 1555 sometime in 2015.
Please be cautioned, THIS IS NOT A RECOMMENDATION TO BUY OR SELL ANY COMPONENT OF HUI OR GOLD AND SILVER STOCKS.
********
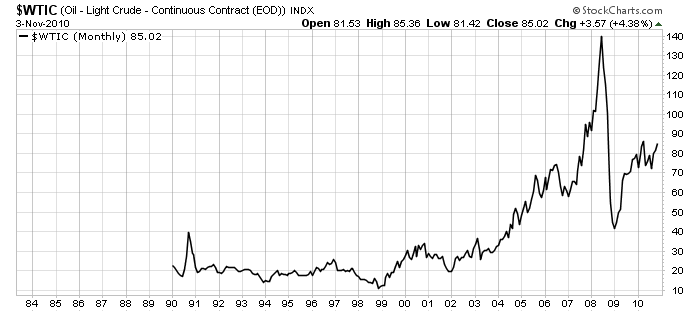
The Rule of Seven�2010 APPLIED TO CRUDE OIL
Crude Oil chart shows initial leg was from 2001 ($4) to Jan2008 ($20):
********
Initial First Leg = 140 - 30 = 110 1st price objective is calculated 110 x 7 = 770 And 770/4 = 192 Therefore 1st price objective is: 30 + 192 >>> $222
********
2cd price objective is calculated 770/3 = 257 Therefore 2cd price objective is: 30 + 257 >>> $287
********
3rd price objective is calculated 770/2 = 385 Therefore 3rd price objective is: 30 + 385 >>> $415
An estimate time frame for crude oil to reach the three price objectives might be approximately the same as for gold to reach its three price objectives (per the Rule of Seven). Specifically. Crude Oil might reach $222 in 2011, $287 in 2013 and $415 sometime in 2015.
Please be cautioned, THIS IS NOT A RECOMMENDATION TO BUY OR SELL ANY FORM OF CRUDE OIL.
********
The Rule of Seven 2010 APPLIED TO US$ Index
To be able to use the Rule Of Seven, I used the reciprocal of the US$ Index.
The chart of the reciprocal of the US$ Index shows initial leg was from 1985 (0.00620) to 1992 (0.0127):
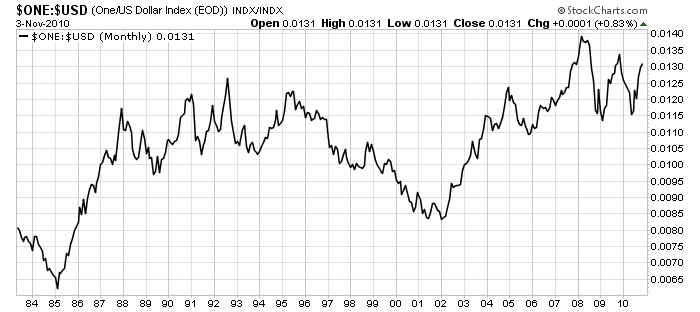
Employing the same Rule of Seven methodology, I obtained the following US$ Index price objectives:
1st price objective might see the US$ fall to 58
2cd price objective might see the US$ fall to 47
3rd price objective might see the US$ fall to 29
Whereas the price objectives of gold, silver and crude oil are determined for the most part by market dynamics of supply and demand, the US$ is affected mostly by political forces and the machinations of the Fed. Nonetheless, the Rule of Seven is predicting a much lower value going forward. And although I feel a US$ objective of 29 is NOT FEASIBLE, I do believe we are presently headed for 58 and possibly 47 in the next few years. QE2 and global beggar thy neighbor Competitive Devaluations will pave the way for a much lower greenback.
Please be cautioned, THIS IS NOT A RECOMMENDATION TO BUY OR SELL ANY FORM OF US Dollar. I am merely sharing my research reading with you.
********
(*) Source: The Rule of Seven price forecast method is from the book, "TECHNIQUES OF A PROFESSIONAL COMMODITY CHART ANALYST" by Arthur Sklarew (first published in 1980).
By I. M. Vronsky
Editor & Partner - Gold-Eagle
www.gold-eagle.com
© 2010 Copyright I. M. Vronsky - All Rights Reserved
Disclaimer: The above is a matter of opinion provided for general information purposes only and is not intended as investment advice. Information and analysis above are derived from sources and utilising methods believed to be reliable, but we cannot accept responsibility for any losses you may incur as a result of this analysis. Individuals should consult with their personal financial advisors.
© 2005-2022 http://www.MarketOracle.co.uk - The Market Oracle is a FREE Daily Financial Markets Analysis & Forecasting online publication.