


Staying Short into Stock Market Election Uncertainty
Stock-Markets / Stock Markets 2010 Nov 02, 2010 - 09:25 AM GMTBy: Mark_McMillan

 Market participants moved the major indexes up over one percent only to see them come crashing back down and finishing flat as we await election results and the FOMC decision on interest rates and QE2...
Recommendation: Take no action.
Daily Trend Indications:
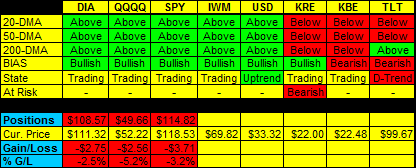
- Positions indicated as Green are Long positions and those indicated as Red are short positions.
- The State of the Market is used to determine how you should trade. A trending market can ignore support and resistance levels and maintain its direction longer than most traders think it will.
- The BIAS is used to determine how aggressive or defensive you should be with a position. If the BIAS is Bullish but the market is in a Trading state, you might enter a short trade to take advantage of a reversal off of resistance. The BIAS tells you to exit that trade on "weaker" signals than you might otherwise trade on as the market is predisposed to move in the direction of BIAS.
- At Risk is generally neutral represented by "-". When it is "Bullish" or "Bearish" it warns of a potential change in the BIAS.
- The Moving Averages are noted as they are important signposts used by the Chartists community in determining the relative health of the markets.
Current ETF positions are:
Short DIA at $108.57
Short QQQQ at $49.66
Short SPY at $114.82
Daily Trading Action
The major index ETFs opened higher and immediately shot up even higher and hovered as an economic report was released at 10:00am. This caused the major indexes to rise to their zeniths (up over one percent) by shortly after 10:00am before they rolled over and began a long an tortuous descent. That move would last into the final hour of trading but a rally in the final forty-five minutes allowed the major indexes to climb out of negative territory to make it back to flat by the close. The Russell-2000 (IWM 69.82 -0.48) posted a fractional loss as it underperformed the major indexes all session long. The Semiconductor Index (SOX 371.45 -1.19) also posted a loss as investors took a little off the table. The bank indexes lost a fair amount of ground with the Bank Index (KBE 22.48 -0.11) losing one half of one percent but the Regional Bank Index (KRE 22.00 -0.67) fell three percent, ouch! The 20+ Yr Bonds (TLT 99.67 -0.75) lost about three quarters of one percent after a gap up open at resistance and a rapid descent that eased around 11:00am and a gradual rise from late morning into the close. NYSE volume was light with 958M shares traded. NASDAQ volume was just below average with 1.915B shares traded.
There were five economic reports of interest released:
- Personal Income (Sep) fell -0.1% versus an expected +0.2% rise
- Personal Spending (Sep) rose +0.2% versus the +0.4% rise expected
- PCE Prices-Core (Sep) were flat +0.0% as expected
- ISM Index (Oct) came in at 56.9 versus an expected 54.0
- Construction Spending (Sep) rose +0.5% versus an expected -0.7% fall
The first three reports were released an hour before the open with the other two released a half hour into the session.
The U.S. dollar strengthened under the premise that the strong ISM Index suggests that the economy is stronger than expected and less quantitative easing will likely be implemented.
Tech (+0.4%) led five out of ten economic sectors in the S&P-500 higher. Utilities (-0.9%) and Consumer Staples (-0.1%) moved lower while Consumer Discretionary, Materials, and Finance were all unchanged.
Implied volatility for the S&P-500 (VIX 21.83 +0.63) rose three percent and the implied volatility for the NASDAQ-100 (VXN 22.92 +0.68) made a similar move higher.
The yield for the 10-year note rose two basis points to close at 2.63. The price of the near term futures contract for a barrel of crude oil rose $1.52 to close at $82.95.
Market internals were mixed with advancers edging decliners on the NYSE while decliners led advancers 7:4 on the NASDAQ. Down volume led up by nearly 6:5 on the NYSE but by only a few percent on the NASDAQ. The index put/call ratio fell 0.22 to close at 1.32. The equity put/call ratio rose 0.07 to close at 0.63.
Commentary:
Monday's trading action saw an assault mounted by the bulls that took the S&P-500 up to resistance and to within one point if its 52-week high (last April). However, the bulls were foiled in the attempt and the major indexes moved all the way into negative territory before finishing flat. The uncertainty of the outcome of Tuesday's elections, the Fed's interest rate decision and size of quantitative easing, and the jobs number due at the end of the week have stymied both bulls and bears as no one wants to be caught "offsides".
After the market closed, both Australia and India announced quarter point interest rate increases. They are doing that to battle inflation but it has weakened the U.S. dollar. The dollar will open near the bottom of its range and if it should break lower, this will likely cause a surge for equities. If the dollar holds in its range, then it is likely to continue moving higher, as that is the current short term trend.
We hope you have enjoyed this edition of the McMillan portfolio. You may send comments to mark@stockbarometer.com.
If you are receiving these alerts on a free trial, you have access to all of our previous articles and recommendations by clicking here. If you do not recall your username and/or password, please email us at customersupport@stockbarometer.com.
By Mark McMillan
Important Disclosure
Futures, Options, Mutual Fund, ETF and Equity trading have large potential rewards, but also large potential risk. You must be aware of the risks and be willing to accept them in order to invest in these markets. Don't trade with money you can't afford to lose. This is neither a solicitation nor an offer to buy/sell Futures, Options, Mutual Funds or Equities. No representation is being made that any account will or is likely to achieve profits or losses similar to those discussed on this Web site. The past performance of any trading system or methodology is not necessarily indicative of future results.
Performance results are hypothetical. Hypothetical or simulated performance results have certain inherent limitations. Unlike an actual performance record, simulated results do not represent actual trading. Also, since the trades have not actually been executed, the results may have under- or over-compensated for the impact, if any, of certain market factors, such as a lack of liquidity. Simulated trading programs in general are also subject to the fact that they are designed with the benefit of hindsight. No representation is being made that any account will or is likely to achieve profits or losses similar to those shown.
Investment Research Group and all individuals affiliated with Investment Research Group assume no responsibilities for your trading and investment results.
Investment Research Group (IRG), as a publisher of a financial newsletter of general and regular circulation, cannot tender individual investment advice. Only a registered broker or investment adviser may advise you individually on the suitability and performance of your portfolio or specific investments.
In making any investment decision, you will rely solely on your own review and examination of the fact and records relating to such investments. Past performance of our recommendations is not an indication of future performance. The publisher shall have no liability of whatever nature in respect of any claims, damages, loss, or expense arising out of or in connection with the reliance by you on the contents of our Web site, any promotion, published material, alert, or update.
For a complete understanding of the risks associated with trading, see our Risk Disclosure.
© 2010 Copyright Mark McMillan - All Rights Reserved
Disclaimer: The above is a matter of opinion provided for general information purposes only and is not intended as investment advice. Information and analysis above are derived from sources and utilising methods believed to be reliable, but we cannot accept responsibility for any losses you may incur as a result of this analysis. Individuals should consult with their personal financial advisors.
© 2005-2022 http://www.MarketOracle.co.uk - The Market Oracle is a FREE Daily Financial Markets Analysis & Forecasting online publication.